Curious what your development peers are using in their Java tech stacks? The results of the 2021 Java Developer Productivity Report are pulled from our annual survey, which garnered nearly 900 responses from Java development professionals around the globe.
In the report below, we look at the top Java technologies for 2021, including application server, runtime platform, framework, IDEs, database, build tools, and more.
Back to topThe 2025 Java Developer Productivity Report Is Here!
Get the latest data points on the tools and technologies your Java development peers are using.
Popular Java Technologies in 2021
In this segment of the 2021 Java developer report, we focused on the technologies developers are using to run their applications in development. You can see the results for those questions below.
Most Popular Java Version
We asked developers what Java programming language they are using in their main application. Developers were able to select multiple answers if they are using more than one language, as this tends to be most common.
At 69%, most respondents reported using Java 8 as the programming language of choice in their main application. JavaScript was the next highest at 40% of respondents—a huge increase over last year’s report, with only 2% of developers using it. Next is Java 11 at 36% and Java 12 or newer at 16%.
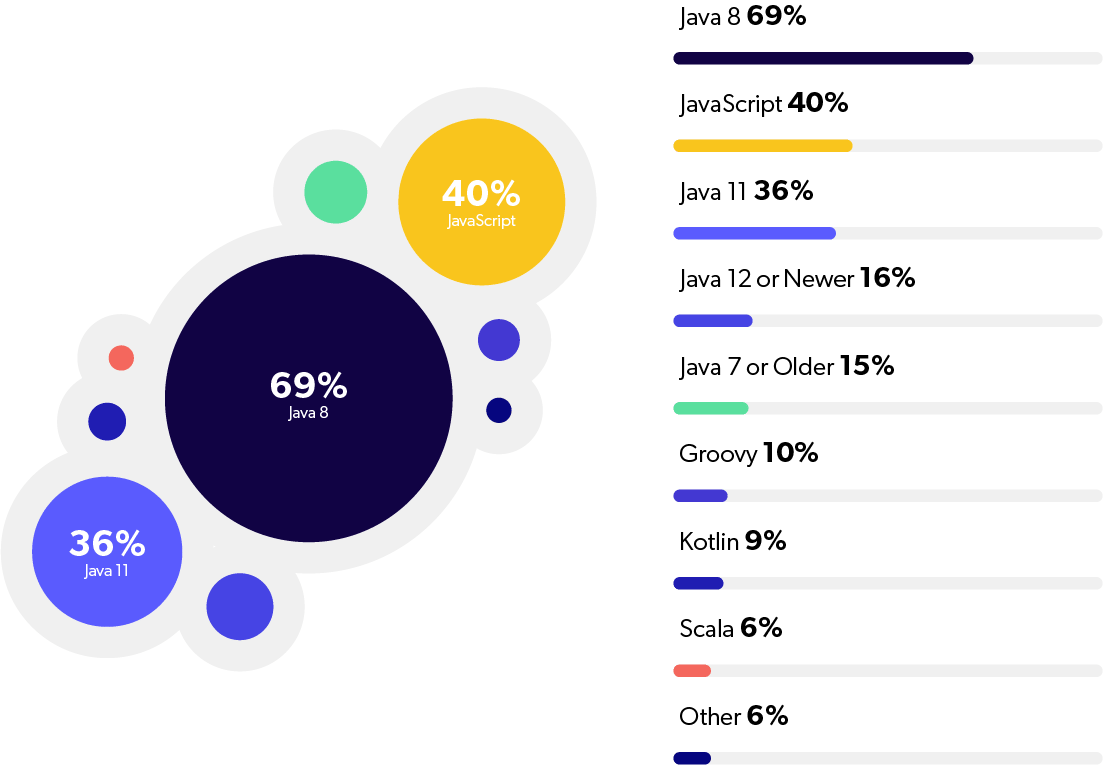
What this means: It's no surprise the most popular Java version in 2021 is Java 8. Oracle may not like it, but the fact is people are very hesitant to update their Java version. Being the last Java release to offer long term support, it’s been the dominant version since its release.
Java 8's popularity may also be because the newer Java features have not been strong enough to convince developers to update to a newer version. The time it takes to upgrade the application to a newer version can deter many companies from ever updating their environment.
Related: OpenLogic offers support for all your migration and upgrade needs.
The uptick in JavaScript may indicate more developers turning to full stack development, pairing JavaScript with Java 8 or another Java version.
Keep an eye out for reports in the coming years to see how Java 17, available in September 2021 and the next LTS release, gains popularity.
Most Popular Java Application Server
As with last year’s report, there is little variation in application server. Tomcat continues to dominate the field, with more than three times more respondents than the next popular choice—JBoss/Wildfly.
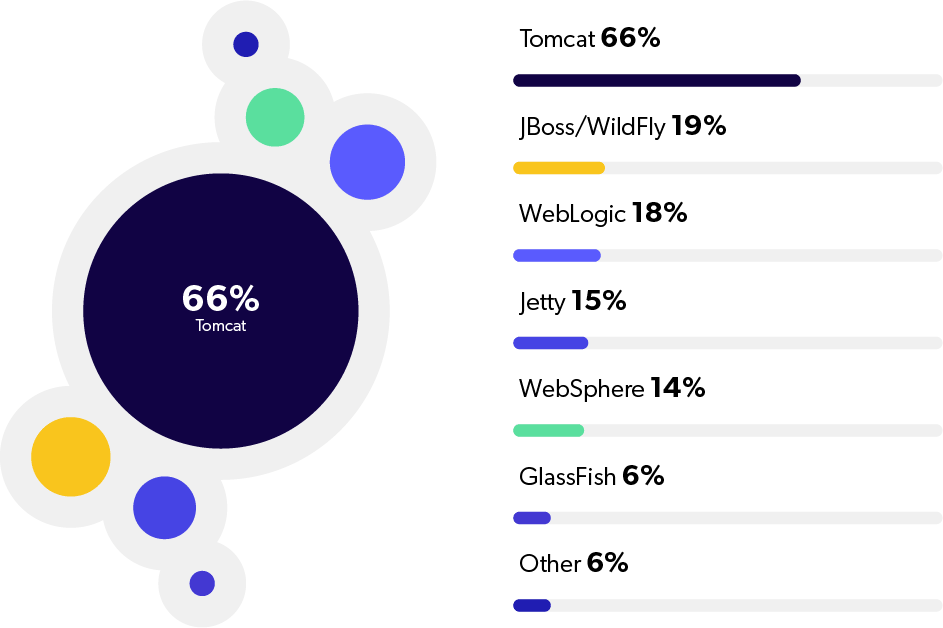
What this means: Tomcat is an overwhelmingly popular choice, and for good reason. For one, it’s free, making it attractive for small and large teams alike. The server is also highly compatible with platforms such as SAP Commerce Cloud, Spring Boot, Docker, AWS, and others due to its small size and portability. We will continue to see people moving away from the large monolithic application servers and into more agile options.
Most Popular Java Application Framework
We asked developers what application framework they are using on their main project, and the top answer was once again Spring Boot, with 62% of respondents. This is a slight drop from last year (82%), but Spring Boot is still far and away the most popular framework. Other choices included DropWizard, Quarkus, Micronaut, and Vert.x, at less than 10% each.
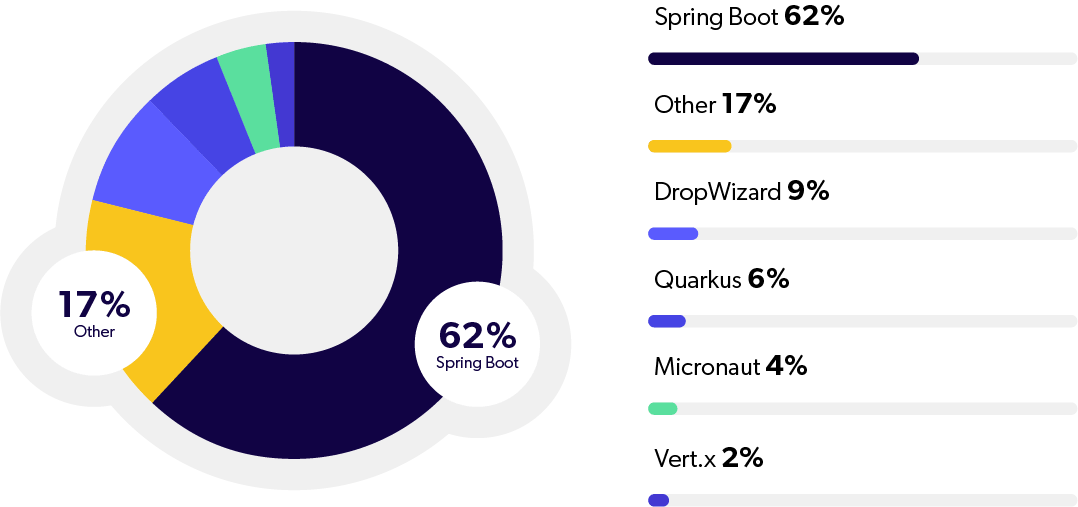
What this means: Spring Boot is popular with microservices development—so no surprise that it matches up to the 66% of respondents who say they are either using, transitioning to, or thinking about transitioning to microservices.
Most Popular Java Framework Configuration
For framework configuration, we found that most respondents were using @Annotations on classes, methods, and fields, or using external xml, yaml, or similar files. This year’s responses were in-line with prior years’—with @Annotations leading the pack.
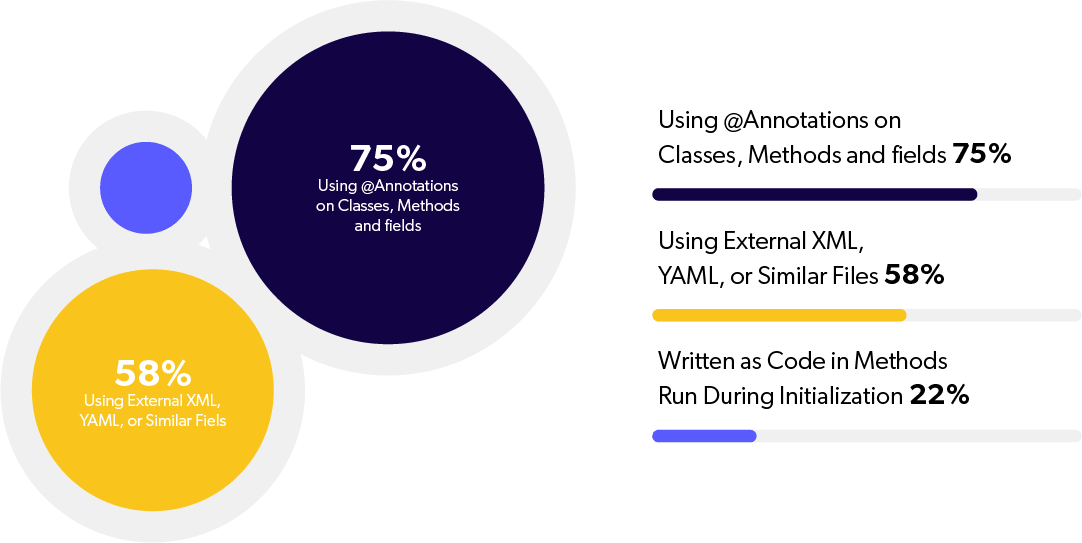
What this means: Engineers are interested in the ability to write code in the least amount of files as possible. Annotations allow developers to quickly and efficiently work with and modify the frameworks being used in their application without needing additional XMLs within the project structure.
Most Popular Java IDE
In this question, we asked what Integrated Development Environment (IDE) developers are using for their Java development. Coming in a solid first place is IntelliJ Idea at 65% followed by Eclipse (48%), VSCode (27%) and NetBeans (13%).
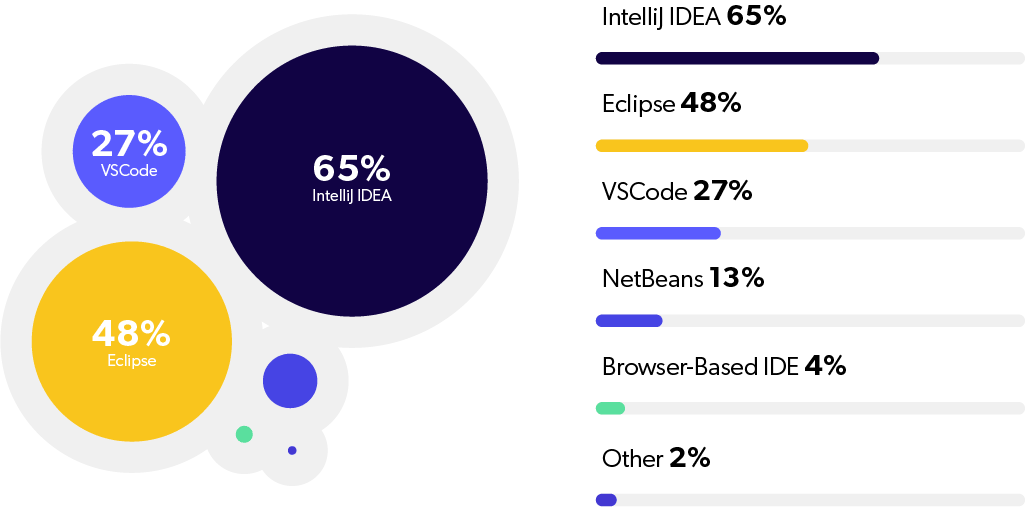
What this means: The fact that VSCode took 27% of votes surprised us. While this question provided users the option to choose multiple different IDEs, it is still very interesting that VSCode is up there. Does this mean more Java developers are using VSCode or (much more likely) does it mean that developers are using different IDEs to meet different needs within their applications? This could definitely be the case should there be full stack development being done.
Most Popular JRE/JDK Distribution
Respondents chose which JRE/JDK distribution(s) they use. Last year’s results showed the majority using Oracle Java (at 50%) and this year is no different, with Oracle Java coming in at 59%.
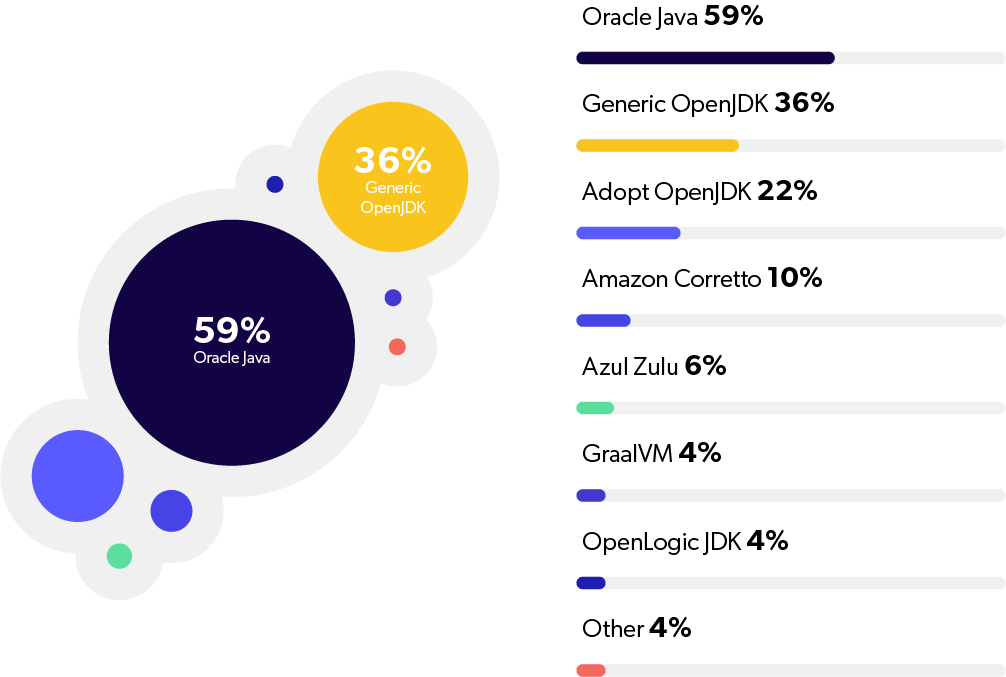
What this means: We expected to see more transition from Oracle to other Java distributions given the high licensing costs from Oracle, but this is not the case. We believe that this has a lot to do with the amount of enterprise developers that filled out the survey—with enterprise companies being slower to transition to newer software architectures.
Related: Find out if migrating from Oracle JDK to OpenJDK is right for your team.
Most Popular Java PaaS Provider
In this question, we asked respondents to select which PaaS provider they used. Twenty four percent of respondents reported not using a PaaS provider at all. Of those who do use one, AWS was the most popular at 39% and Microsoft Azure was second at 24%. Last year, Azure only hit 13.53% of respondents, so this recent boost in popularity is interesting to note.
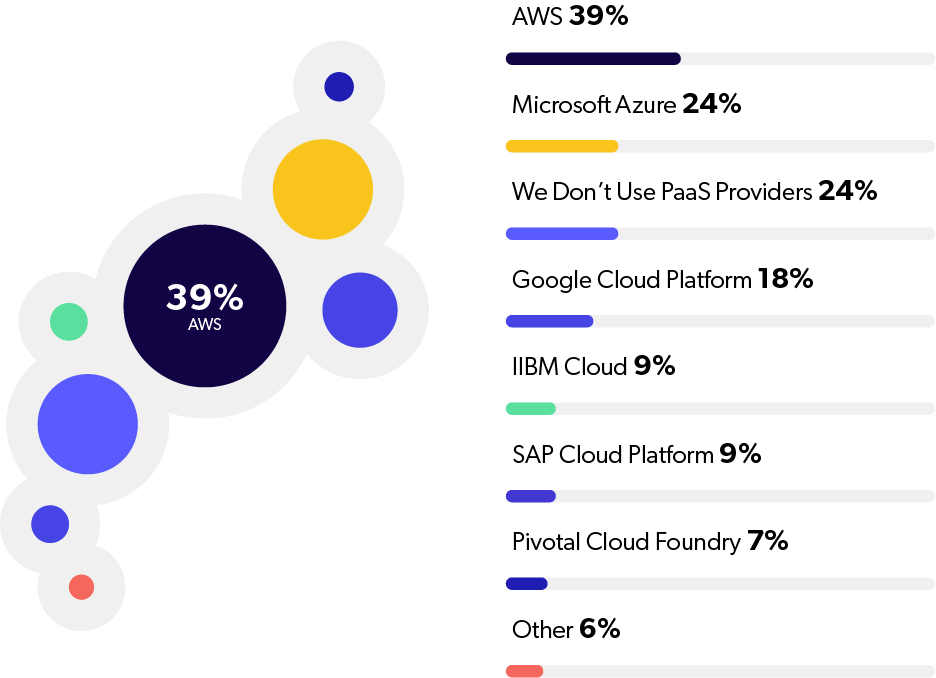
What this means: The PaaS providers of Java developers seem to be quite evenly spread out across the community. There is a continued growing need for solutions on this front that will continue to be a priority in years to come.
Most Popular Java Database
The most popular database among our respondents was MySQL, at 43%, followed closely behind by Oracle DB and PostgreSQL. Other SQLs (a catch-all for databases not explicitly listed in the answer choices) was next with 16% of respondents.
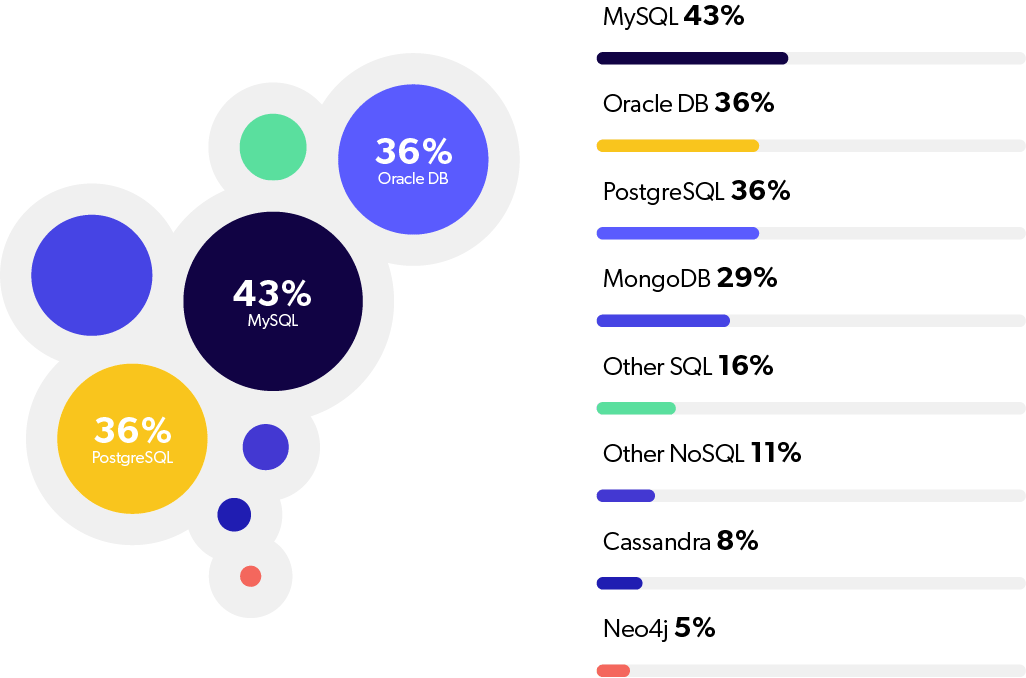
What this means: This is a bit of a switch from last year. PostgreSQL led the pack in 2020, followed by Oracle DB, and then MySQL. Despite this, the playing field seems to be evenly spread across these top three databases.
Most Popular Java Virtualization Tools
The last question we asked involved virtualization tools. And, as no surprise to anyone, Docker led the pack as a developer favorite yet again. This year showed 57% of developers using Docker, compared to 73% last year. Second up was Kubernetes at 42%, compared to last year’s 35%.
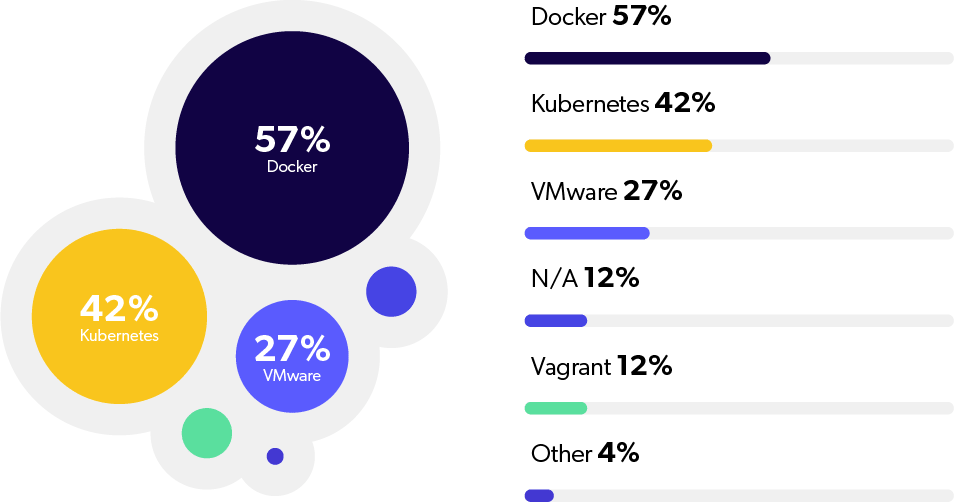
What this means: The popularity of Docker and Kubernetes are no surprise. With so many developers reporting microservices usage, we expected to see a boost in containerization.
Back to topTechnology Report Wrap-Up
Over the course of our annual reports, we’ve seen how microservices have molded and shaped the technologies developers are using. As the majority of developers are on-track to either be using or transitioning to microservices in the near future, we expect technology choices to trend even more towards the needs of developers working in that arena.
Want to turn insights into actions? Try JRebel. See for yourself how much time you could save by eliminating redeploys during your 14-day free trial.