In our 2020 Java technology report, we look at results of our 2020 Java developer survey related to technology choice. The survey gained nearly 400 responses from Java development professionals around the globe. In the report below, we look at the top Java technologies for 2020, including application server, runtime platform, framework, IDEs, database, build tools, and more.
Back to topThe Most Popular Java Technologies in 2020
In this segment of the 2020 Java developer report, we focused on the technologies developers are using during development. Our Java technology usage questions asked respondents to select their currently used programming language, application architecture, application server, runtime platform, framework technologies, framework configuration, IDE, JRE/JDK distribution, PaaS provider, databases, deployment model, build tools, and virtualization tools. You can see the results for those questions below.
Download Full 2020 Java Technology Report
Back to topThe 2025 Java Developer Productivity Report is here. Get the scoop on the latest Java trends including cloud development, AI, productivity teams, and more.
Most Popular Java Version
At 58%, the majority of respondents reported using Java 8 as the programming language of choice in their main application. Java 11 was the next highest at 23% of respondents. 7% of survey respondents reported using Java 7 or older, with another 6% of respondents reporting using Java 12 or newer. Kotlin and JavaScript were the least-used at 3% and 2% respectively.
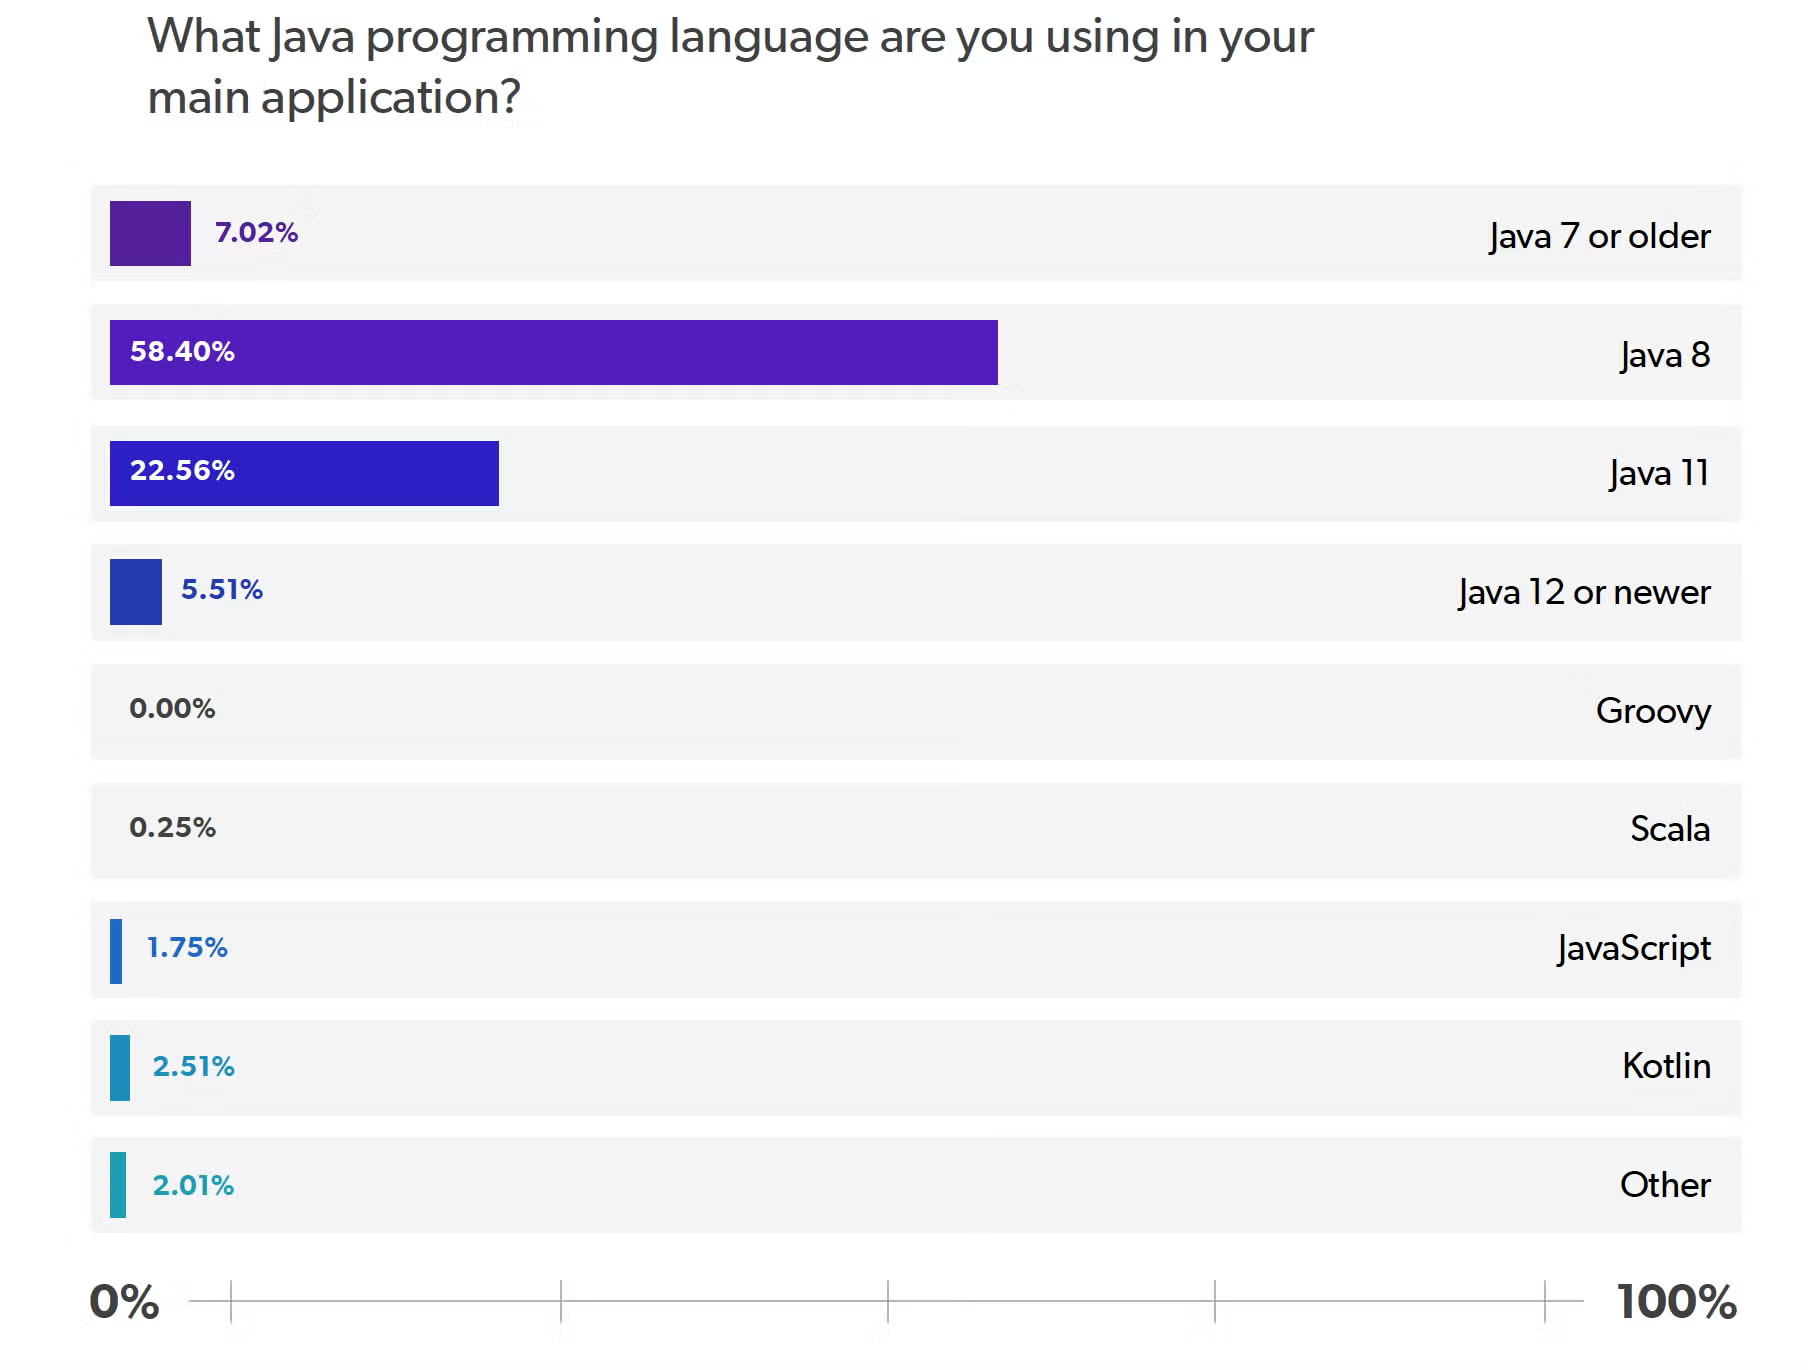
For us, it wasn’t a big surprise to see Java 8 as the dominate programming language. It was surprising, however, to see that only 23% of respondents were using Java 11. We think this has to do with the lack of truly impactful updates to Java since Java 8 and the cost to update the JVM. For respondents still working with Java 7 and older, we expect that number to dwindle as more applications continue to migrate to Java 14 or whatever number is currently available.
Back to topMost Popular Java Application Server
Is application server variety dying? Our survey results show that developers are using Tomcat at nearly five times the rate of the closest competitor, marking a lopsided Java application server market share. With 61% percent of respondents using Tomcat on their main application, it’s clear that Tomcat is the dominant application server. Indeed, the next highest application server was Jetty at 13%, with WebLogic and WebSphere at 7% and 6% usage respectively. Lastly, JBoss/Wildfly usage came in at 5%.
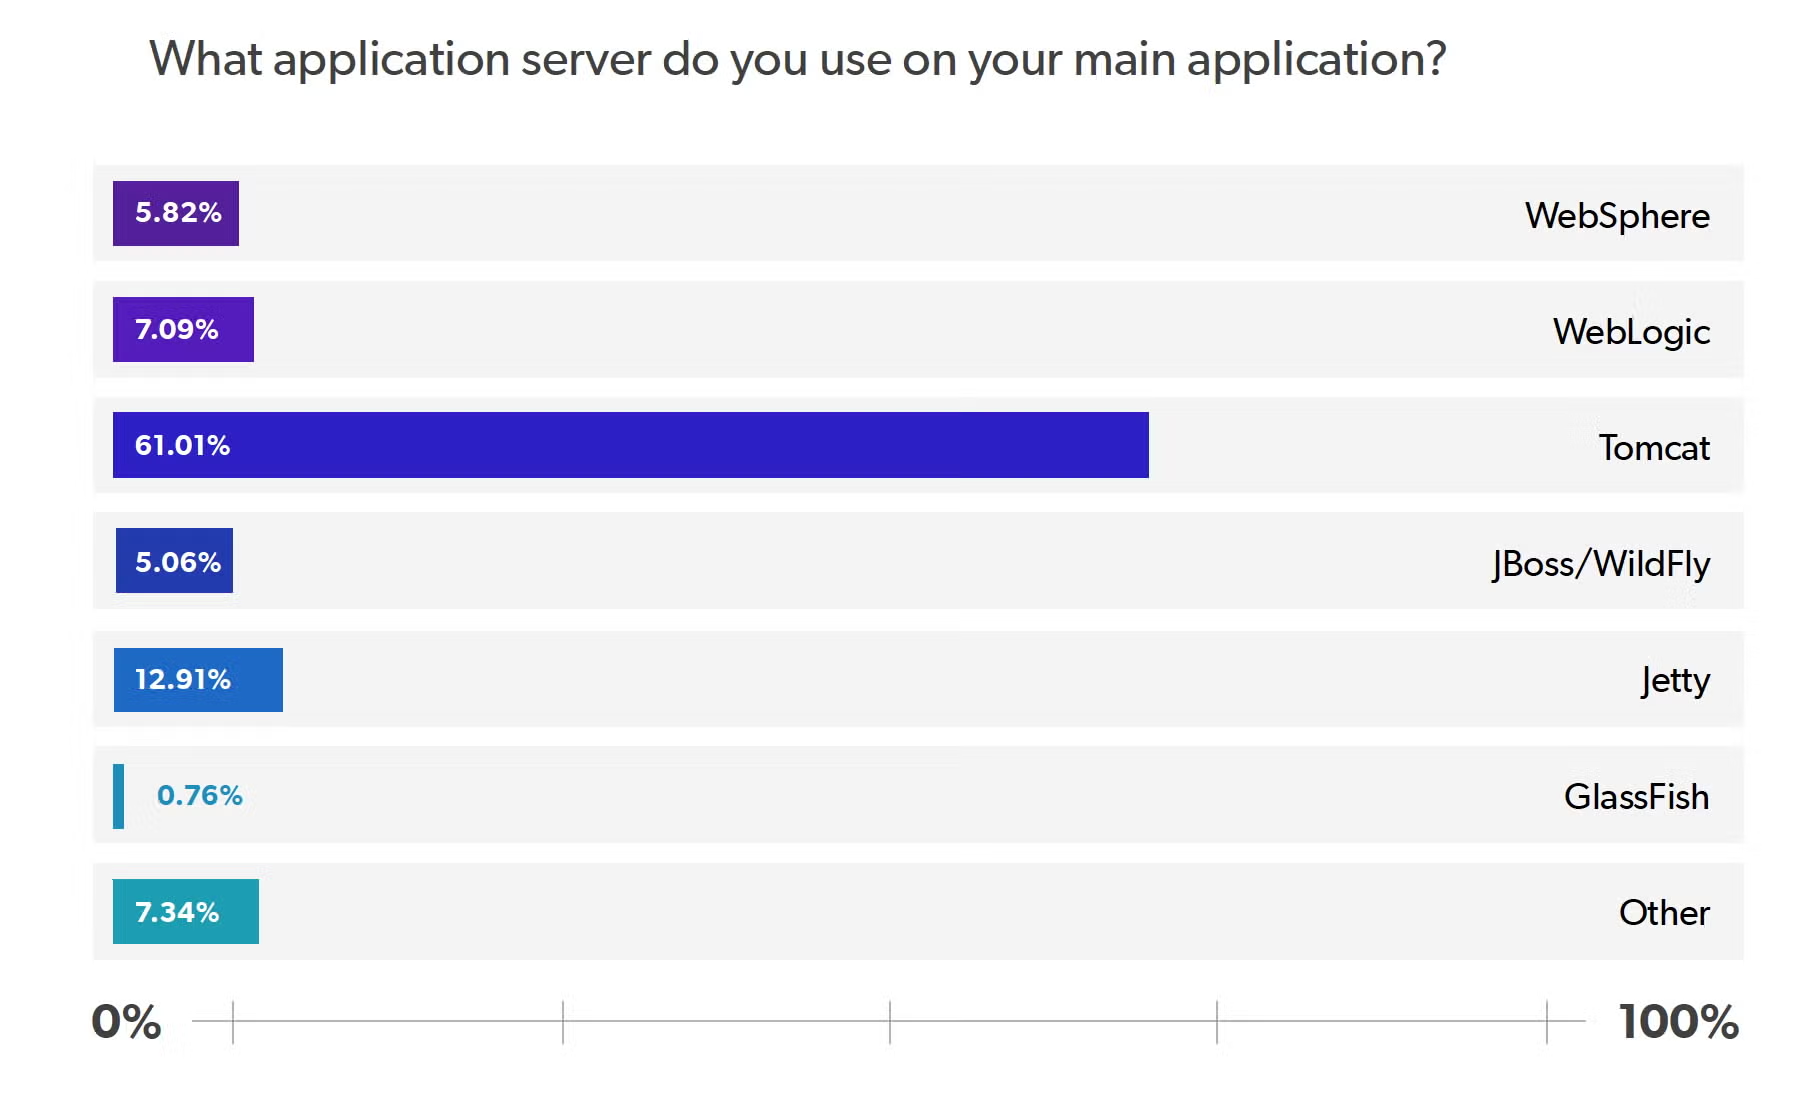
It’s clear that Tomcat is doing something right to garner such a large share of the Java application server market. For me, at least part of that popularity is due to Tomcat’s versatility and its compatibility with other major Java platforms, like Spring Boot, Docker, Hybris, and AWS.
— Curtis Johnson, Product Manager at JRebel
Another major aspect is its cost, it’s free. Hard for management to say no to that! Previously, the lack of support surrounding the application server was one of the core reasons people had used to use application servers like Websphere, Weblogic, and JBoss. It appears that what has happened is Java architecture companies have decided the best way to support application servers is within their architecture as opposed to exclusively in the application server.
Back to topMost Popular Java Runtime Platform
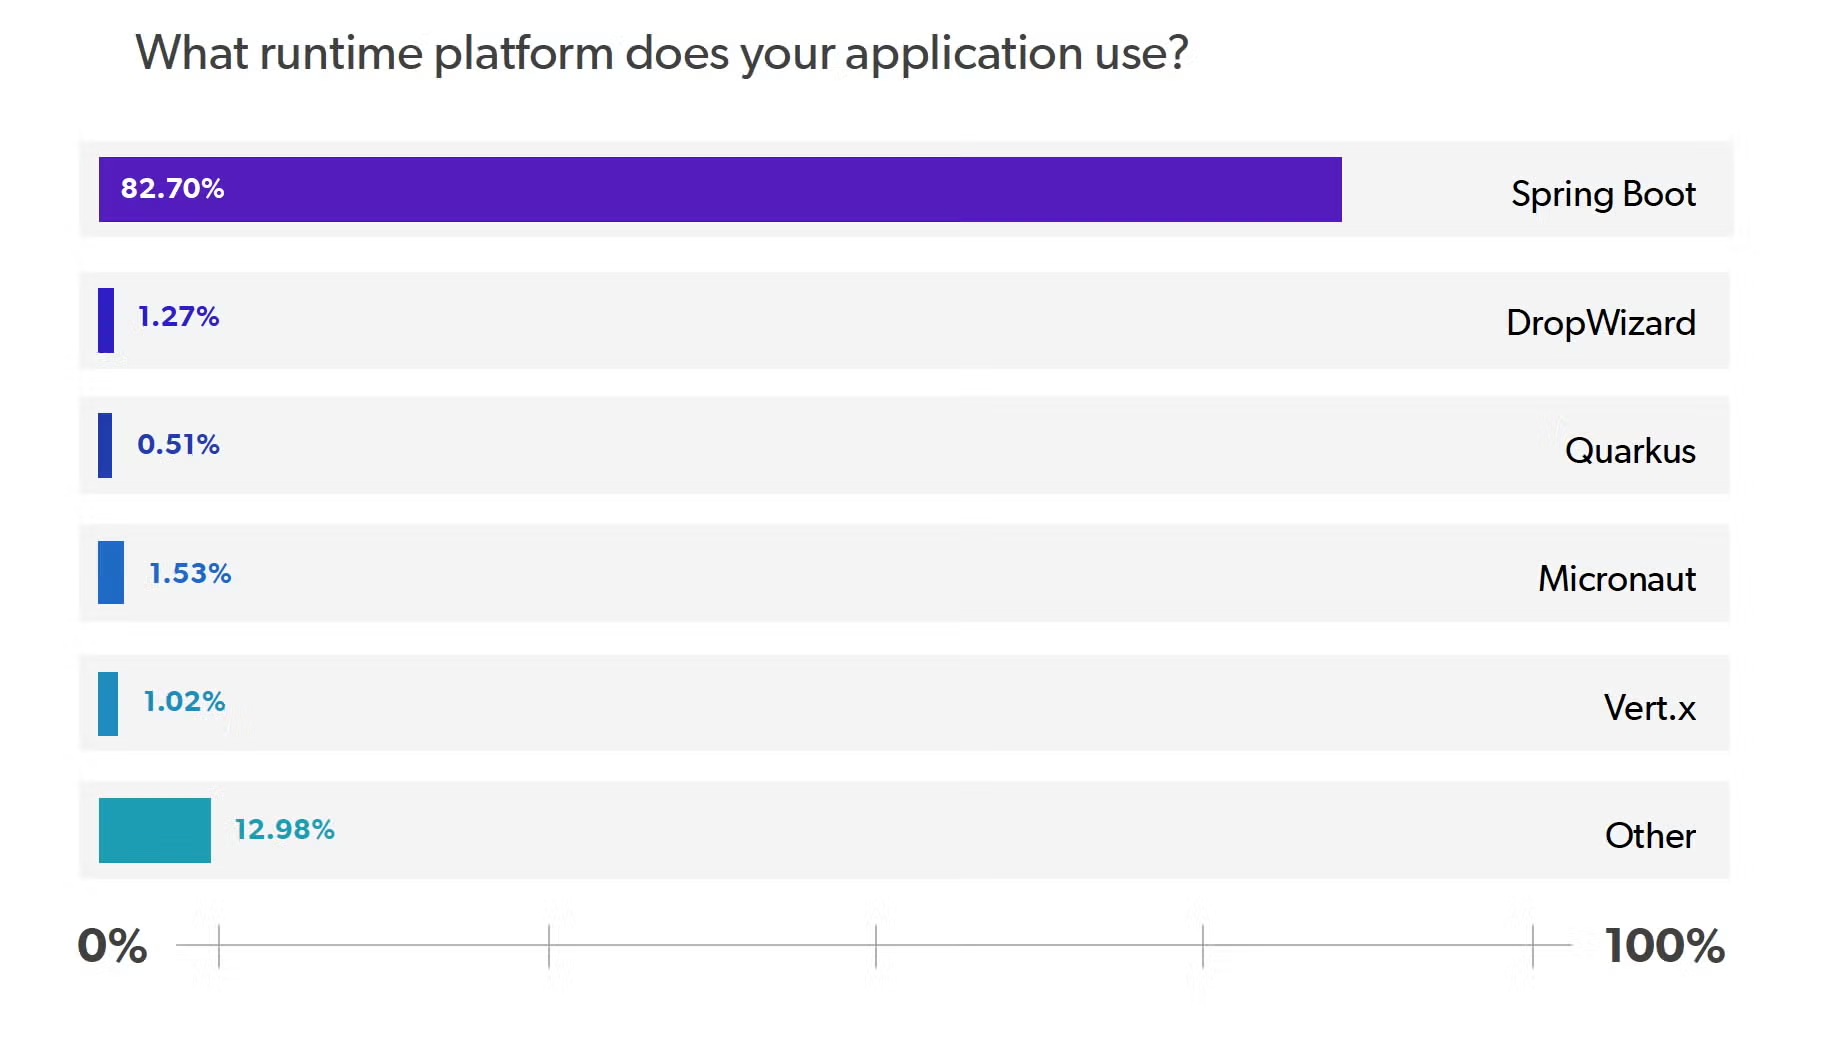
The far and away favorite selection for runtime platform is Spring Boot at 83%. Spring Boot, of course, has been the preferred Java framework for several years now. That’s due, at least in part, to the increased adoption of microservices for Java applications in recent years. At 2% of total respondents, Spring was tied for the second most popular choice, with respondents not using a runtime platform also reporting in at 2% of the total. Respondents using Dropwizard, Micronaut (one of the latest Java technologies gaining momentum), Vert.x, or custom platforms each came in at 1% a piece.
Back to topMost Popular Java Framework Technology
This question asked participants to select the application frameworks and technologies being used on their main project. This question allowed for multiple response as most applications use a variety of different framework technologies.
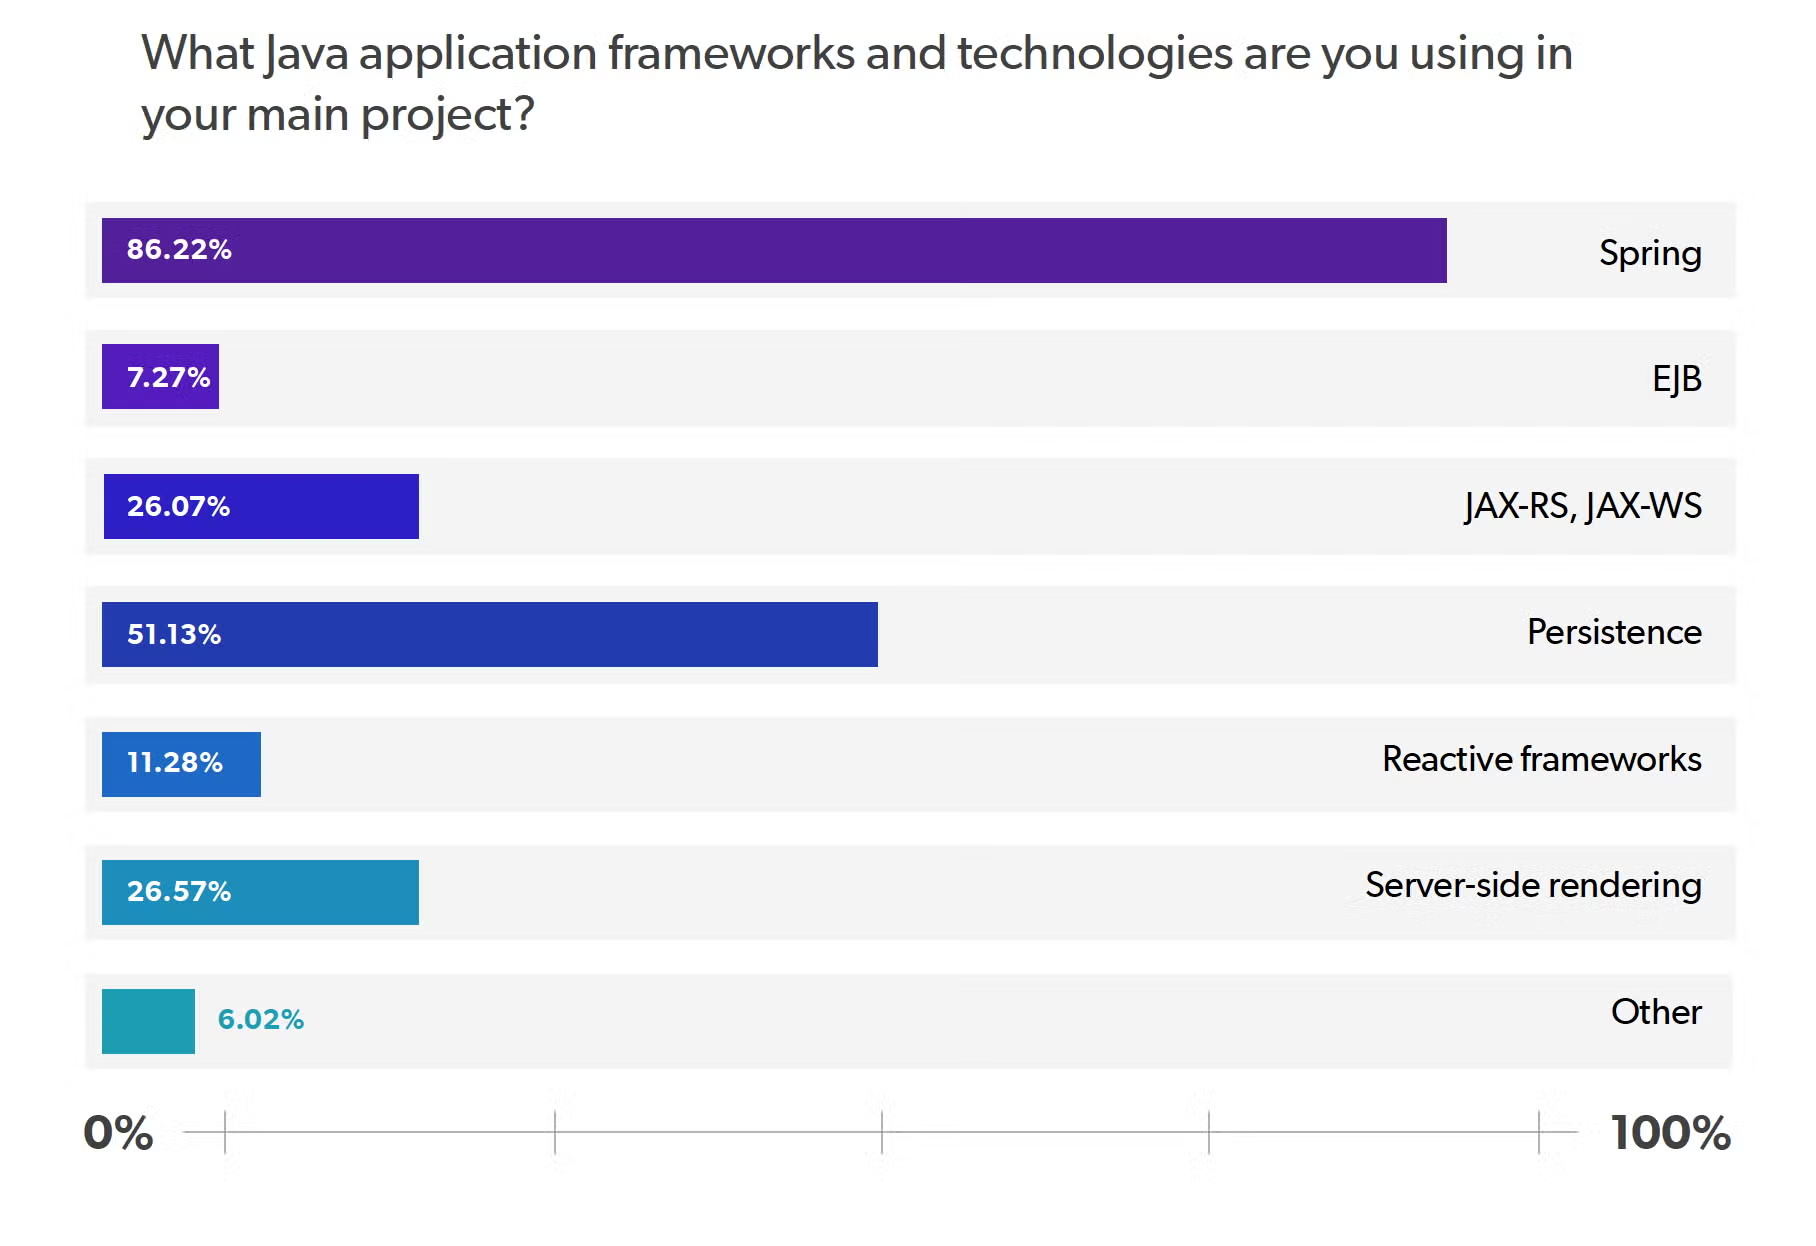
At 86%, most respondents were working with Spring. 51% of respondents reported working with persistence technologies like Hibernate, OpenJPA, or EclipseLink. 27% reported using server-side rendering technologies like JSP, JSF, Thymeleaf, FreeMarker, or GWT. 26% reported using JAX-RS or JAX-WS technologies like Jersey, RESTEasy, CXF, or Axis. For reactive frameworks, 11% of respondents reported using technologies like Vert.x, Akka, RxJava, or Project Reactor. Lastly, 7% of respondents reported using enterprise JavaBeans in their main project.
Back to topMost Popular Java Framework Configuration
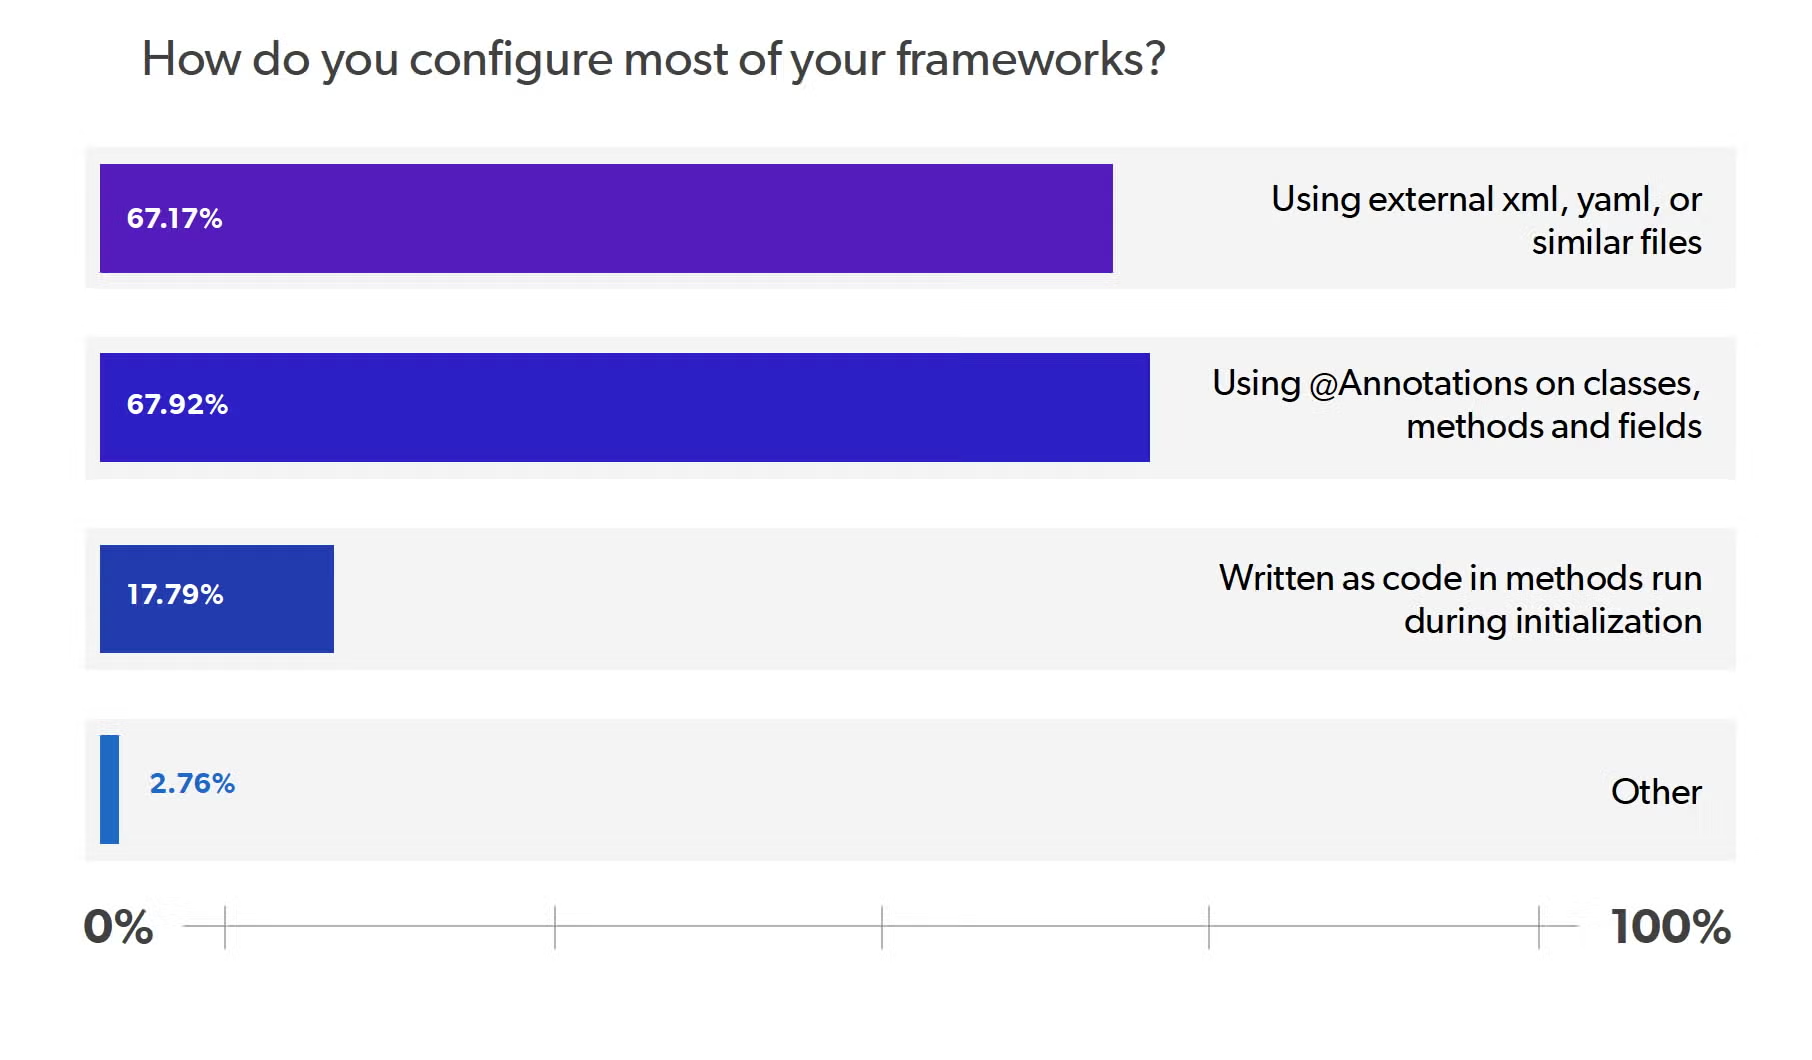
For framework configuration, we found that most respondents were using @Annotations on classes, methods, and fields, or using external xml, yaml or similar files. 68% of users reported using @Annotations, with 67% of users using external xml, yaml, or similar files. 18% of respondents were configuring with code added to methods that run during initialization.
Back to topMost Popular Java IDE
In this question, we asked developers to list the Integrated Development Environment (IDE) they use professionally. As recently as a few years ago, developers would have questioned the value of spending money on an IDE.
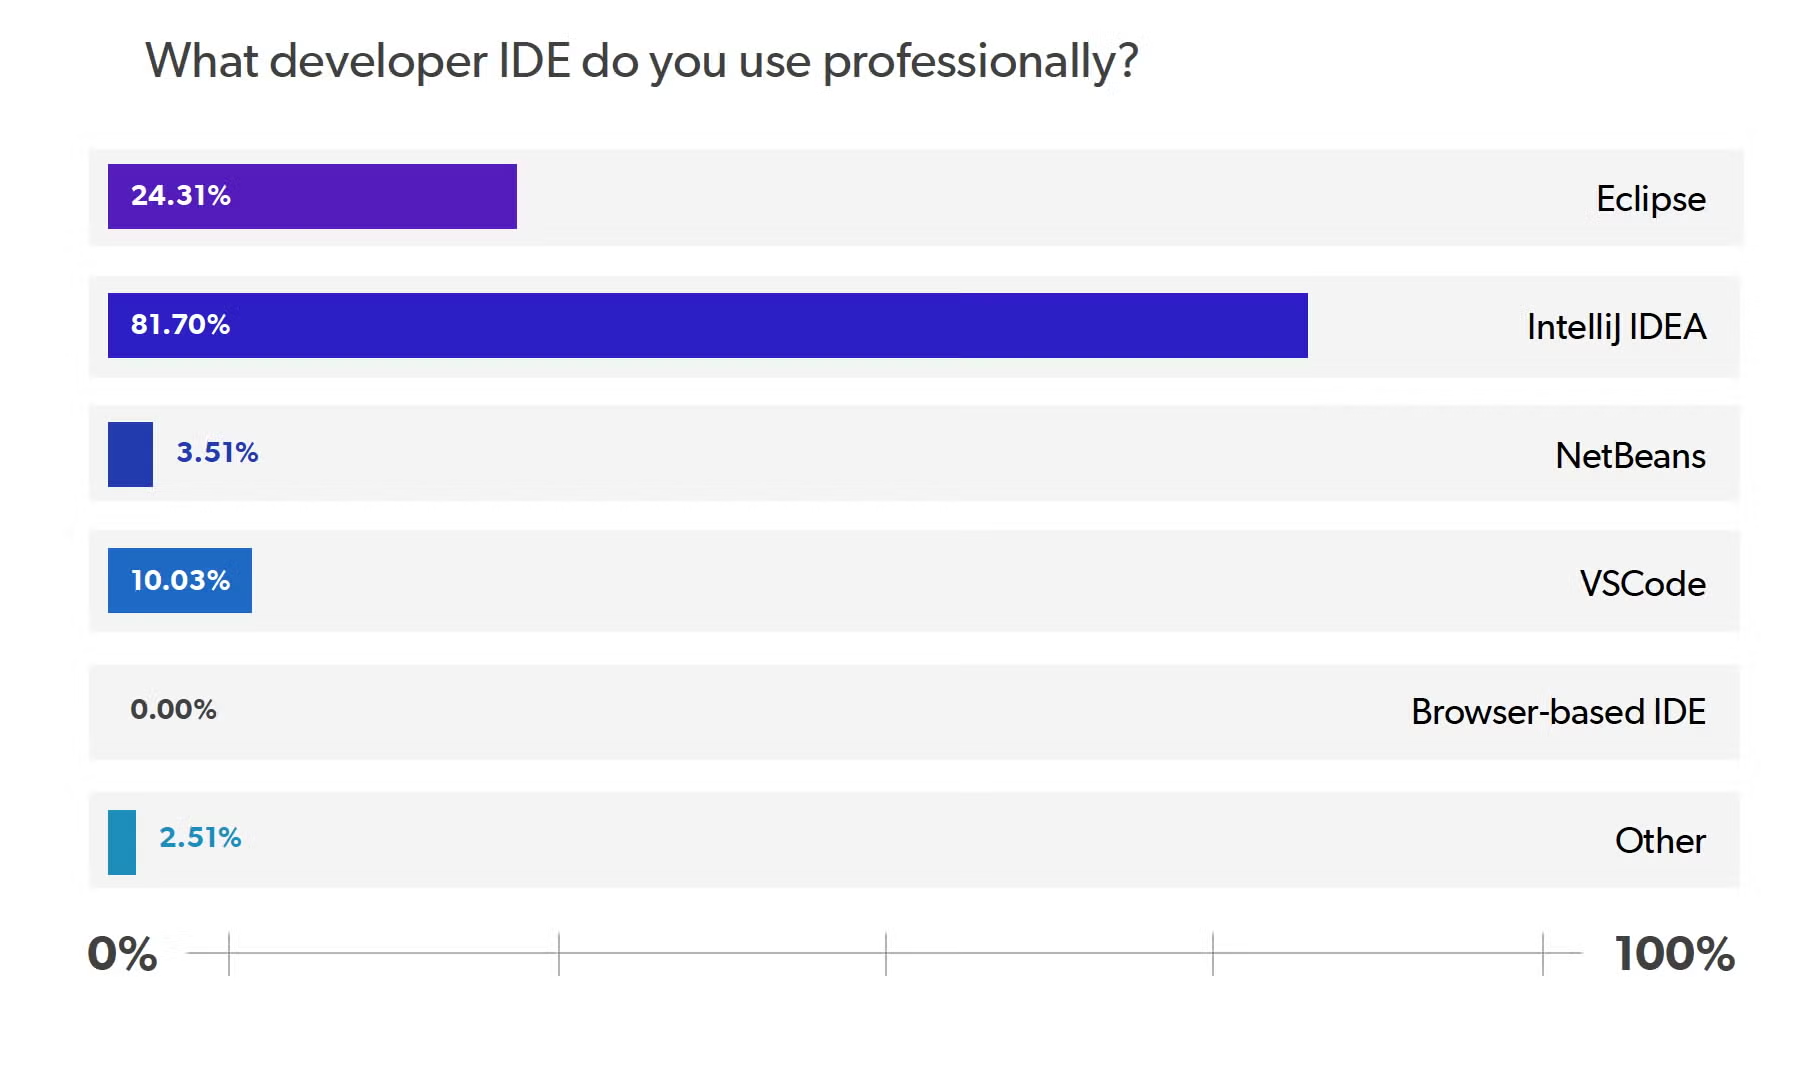
But, with 82% of respondents using IntelliJ IDEA, it’s clear that this paid IDE is well worth the price of admission. The next most used IDE, Eclipse, comes in at 24% with VSCode coming in at 10%. Lastly, 4% of respondents reported using NetBeans in a professional capacity. Netbeans has really lost all its interest through the years with even VSCode passing it in this survey.
Back to topMost Popular JRE/JDK Distribution
In this survey question, we asked respondents to select the JRE/JDK distribution they use. And, in one of the more surprising results from this survey, we found that nearly 50 percent of respondents were using the paid Oracle JDK. That’s 13% more than respondents using Oracle OpenJDK — which reported in at 36%.
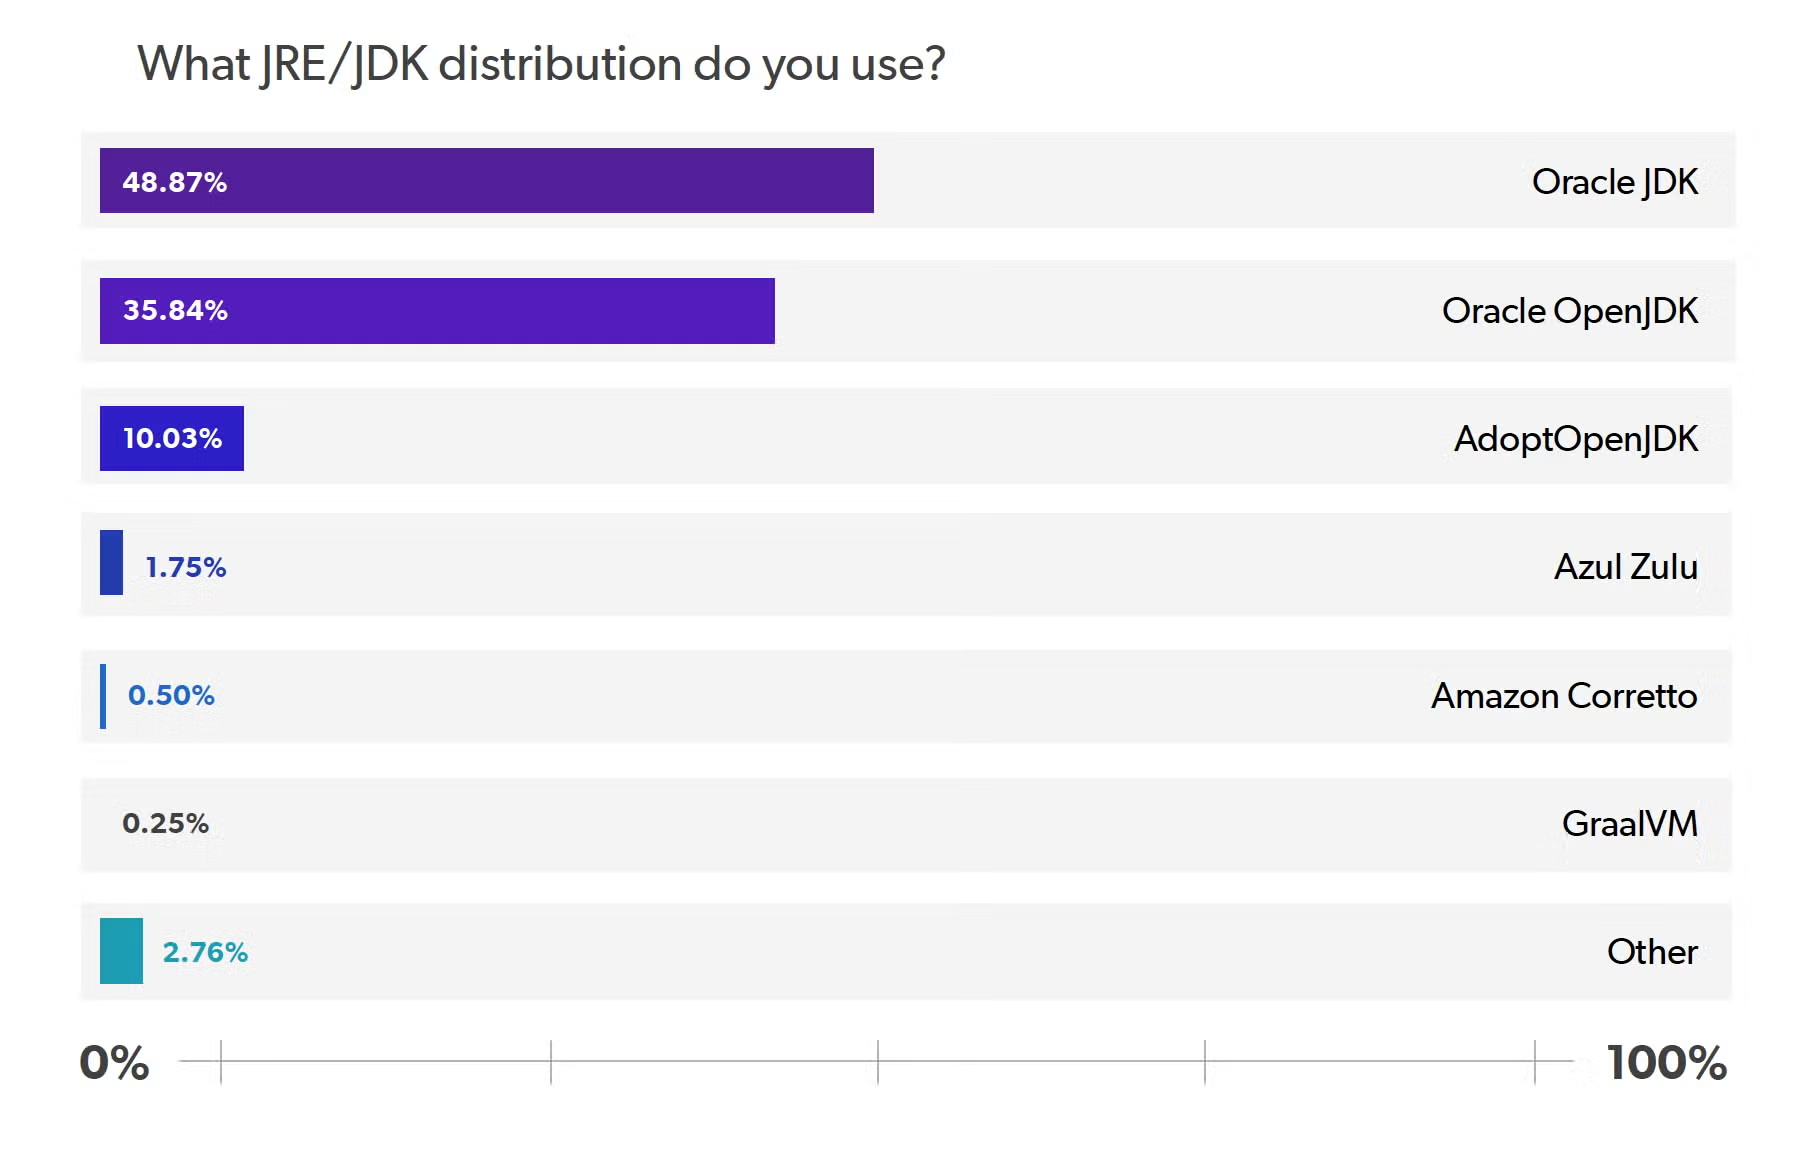
We think that may be due to two reasons: 1. The large Java 8 developer demographic represented in our survey. We think that the number of developers using Java 8 suggests that the project hasn’t been updated in a long period of time which could be what has kept the applications in the Oracle distribution. 2. The support provided by Oracle JDK may be more important than we thought.
It was very surprising to see how many of our survey respondents are paying for Oracle JDK. I fully expected the open source options to have a much larger market share.
— Curtis Johnson, Product Manager at JRebel
Aside from Oracle OpenJDK and Oracle JDK, 10% respondents reported using AdoptOpenJDK, while another 2% reported using Azul Zulu.
Back to topMost Popular Java PaaS Provider
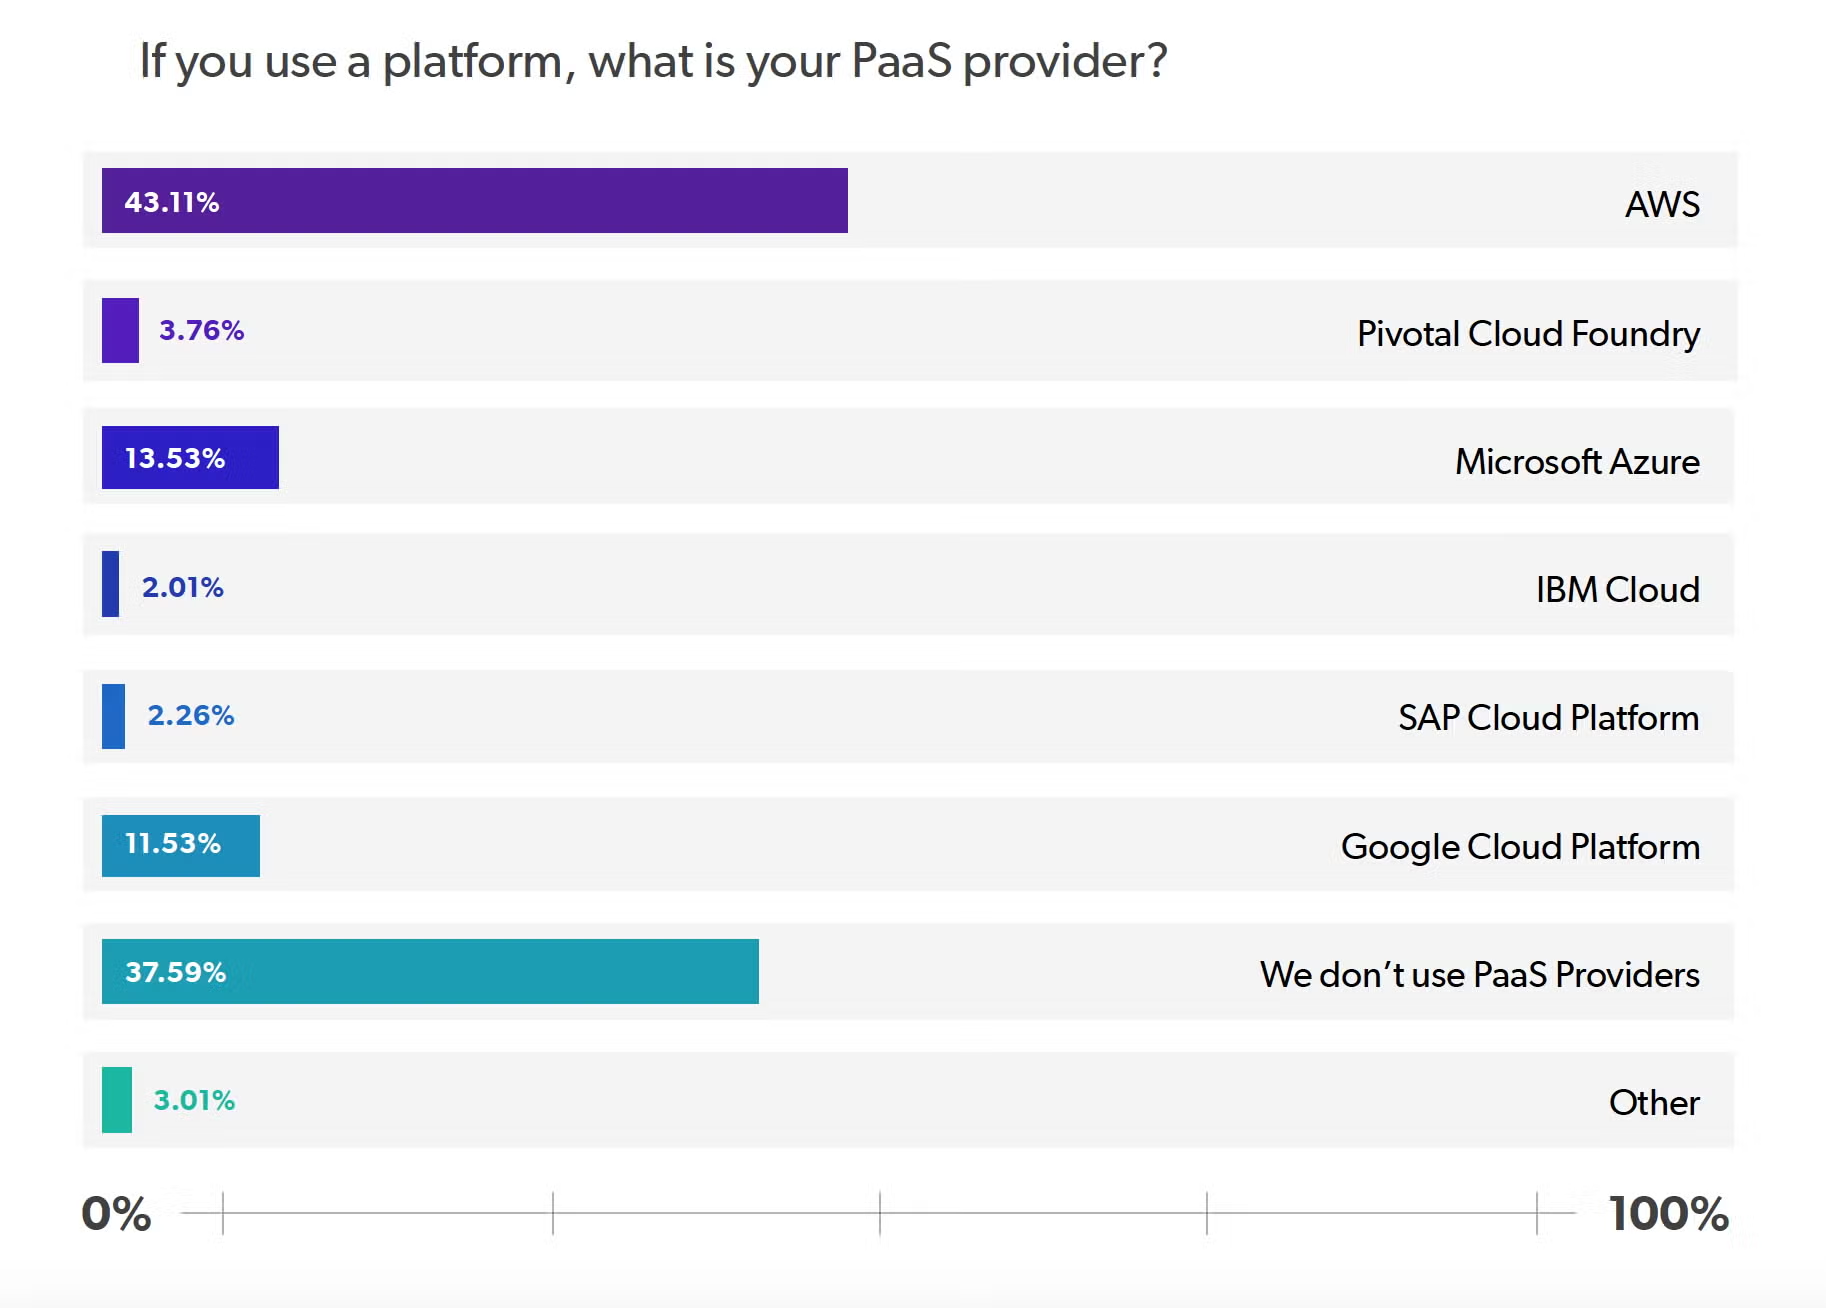
In this question, we asked respondents to select which PaaS provider they used. Of the 60% of respondents using a PaaS provider, 43% use AWS, 14% use Microsoft Azure, and 12% use Google Cloud Platform. Lesser-used providers included Pivotal Cloud Foundry at 4%, with SAP Cloud Platform and IBM Cloud at 2% each.
Back to topMost Popular Java Database
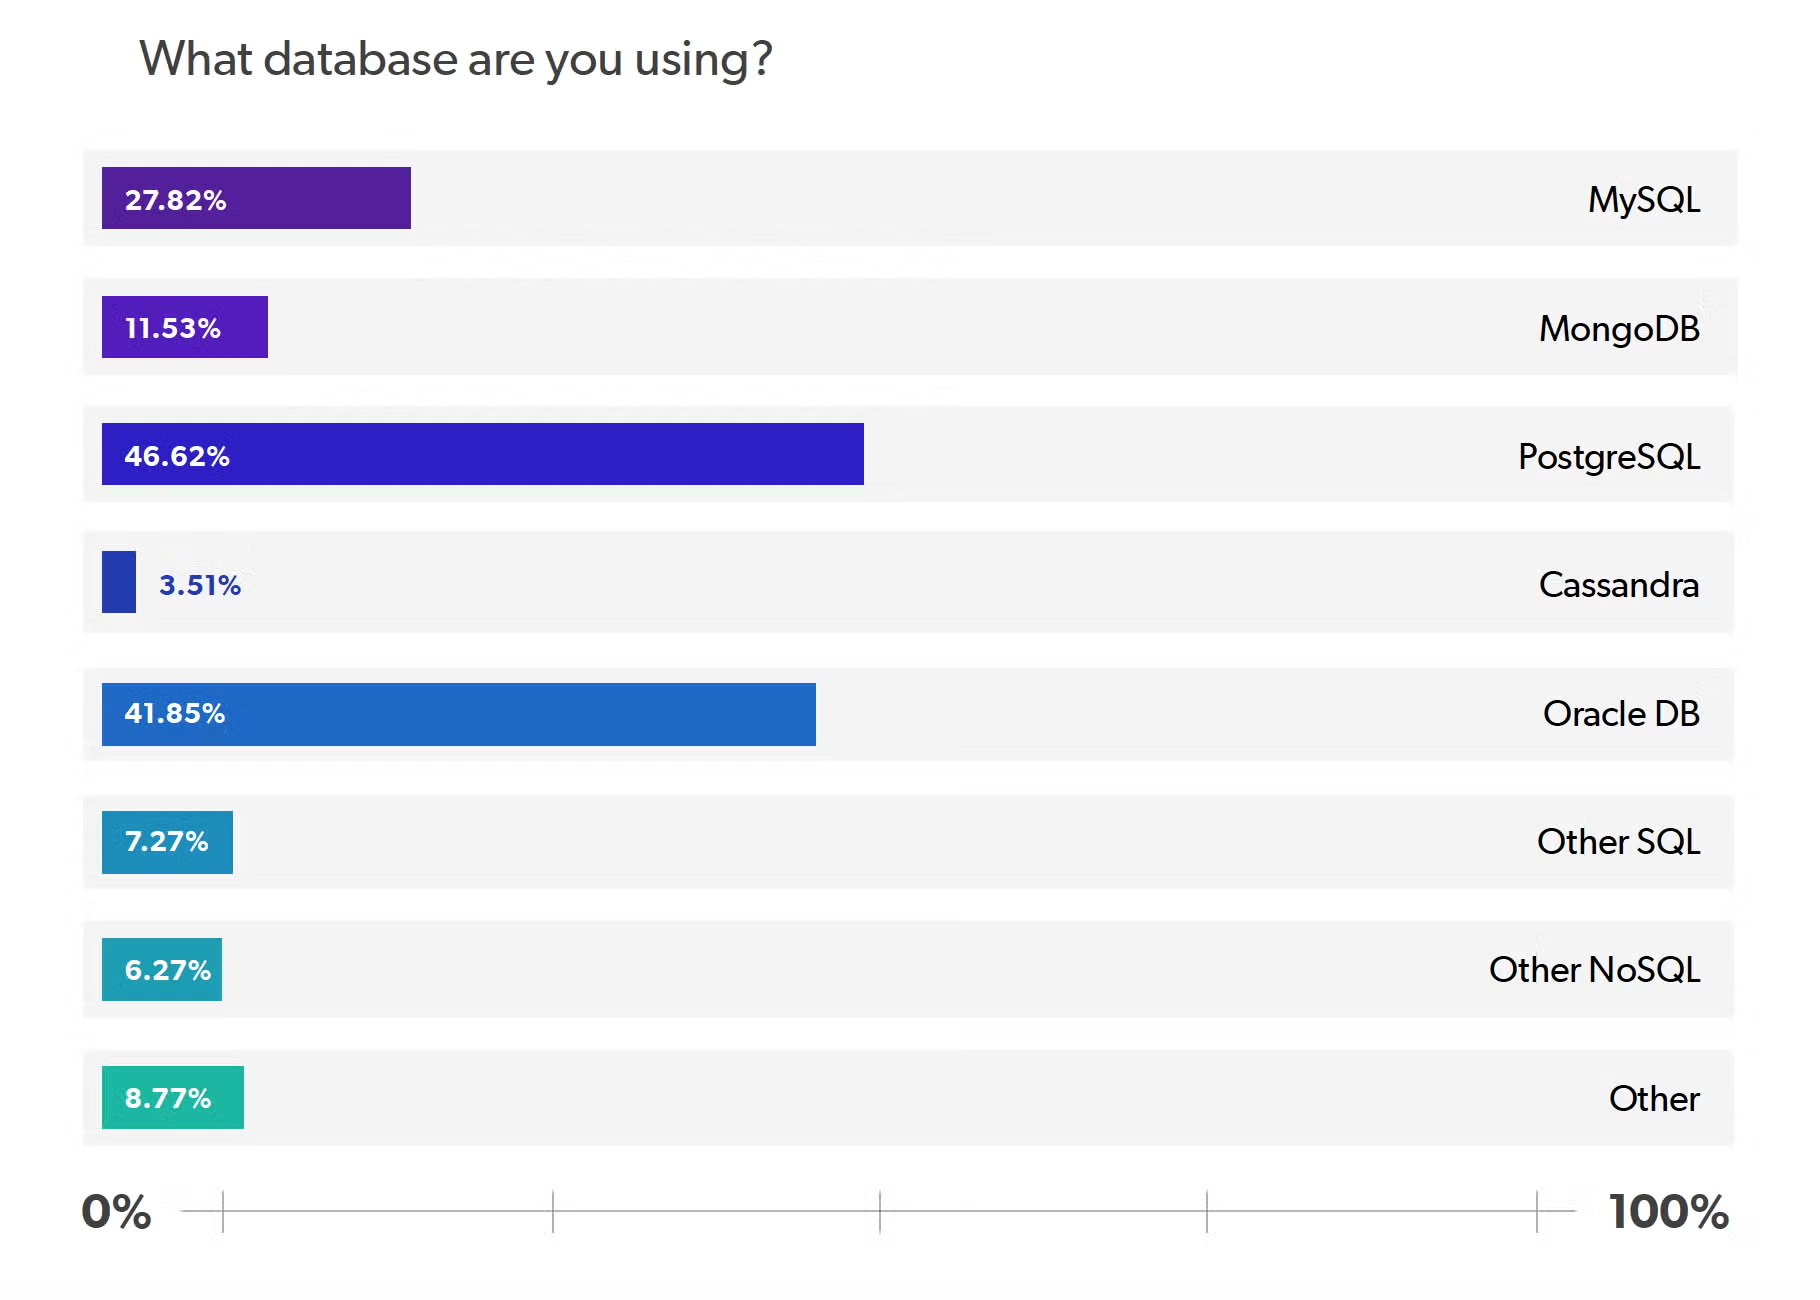
In this question, we asked respondents to select the database(s) they’re currently using. The most popular was PostgreSQL at 47%, with Oracle DB a close second at 42%. Next up was MySQL, with 28% of respondents reporting usage. MongoDB was in fourth place, with 12% of respondents. The least-used databases included SQL, NoSQL, and Cassandra with 7%, 6%, and 4% usage, respectively.
Back to topMost Popular Java Deployment Model
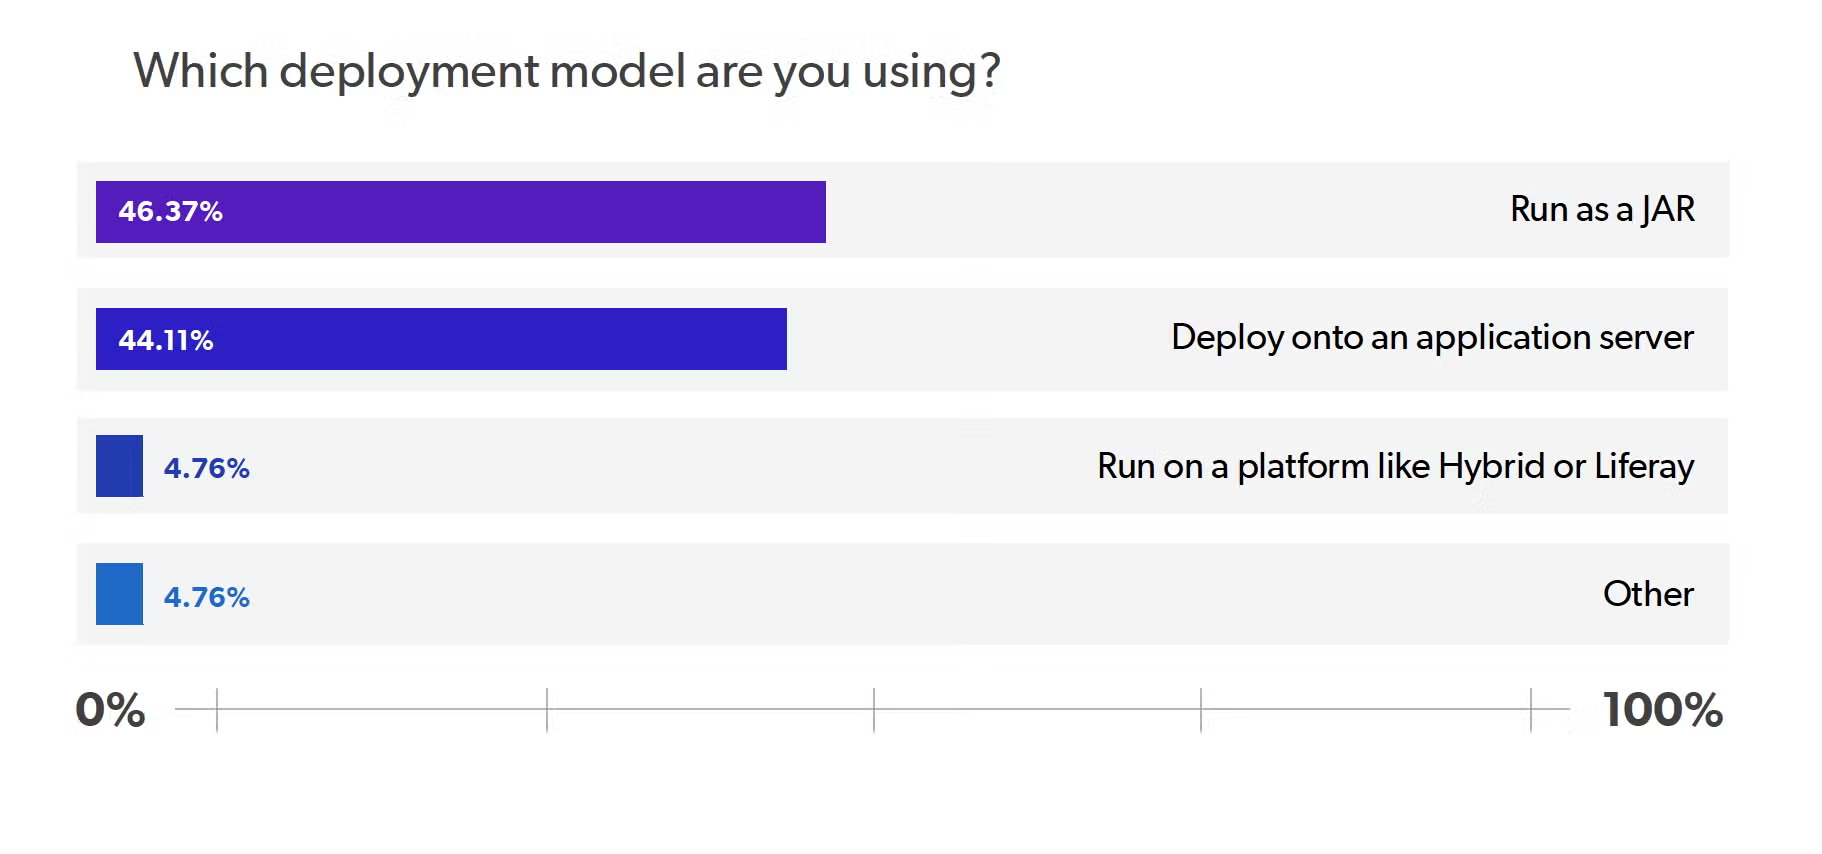
In this question, we asked respondents to tell us which deployment model they use. The most popular deployment model, at 46%, was to run the application as a JAR. 44% of respondents reported deploying onto an application server, while 5% of respondents reported using a platform like Hybris or Liferay to deploy their application.
Back to topMost Popular Java Build Tool
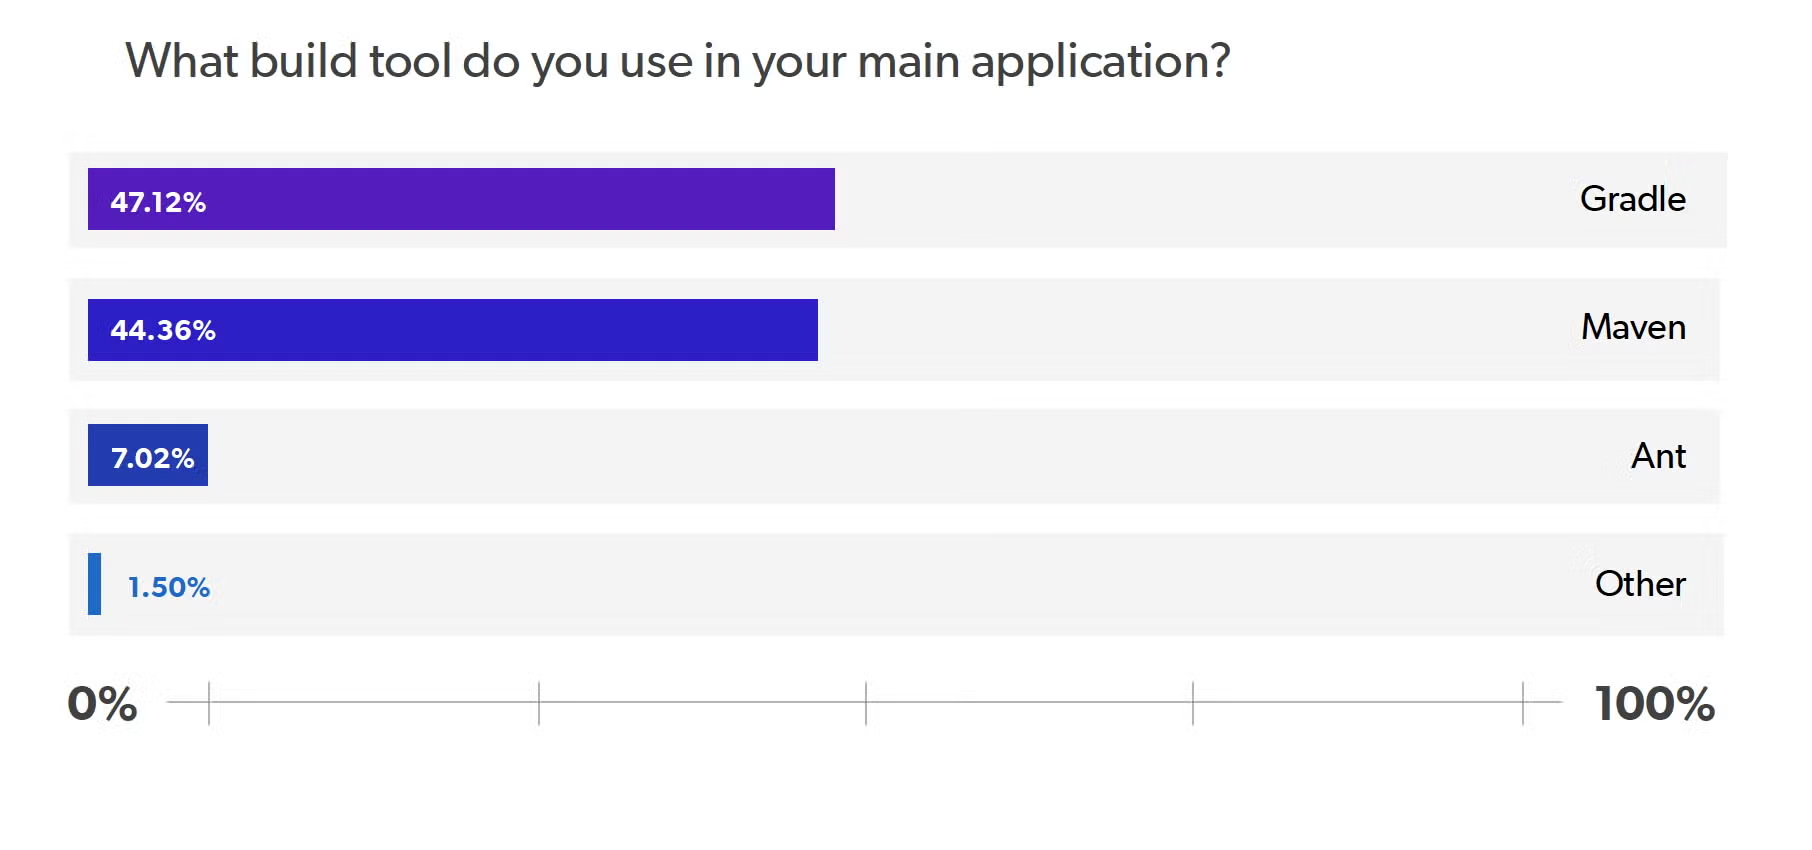
For build tools, we asked developers to pick the tool they use on their main application. Expectedly, Maven and Gradle were the most-used tools. But, perhaps reflecting the amount of respondents working in mobile development, Gradle was the more popular of the two. We don’t think that this reflects the reality of Maven vs Gradle adoption — but it’s interesting to see, regardless. Our survey found that 47% of respondents were using Gradle as a build tool for their main application, while 44% were using Maven. Ant usage trailed both at 7% of respondents.
Back to topMost Popular Java Virtualization Tools
In this question, we asked developers which virtualization tools they use. Far and away the most commonly-used tool was Docker, at 74%. Considering the percentage of Java developers using microservices, this wasn’t a big surprise. Kubernetes was the second most popular virtualization tool at 35%, which shows the continued growth Kubernetes has experienced over the last couple years.
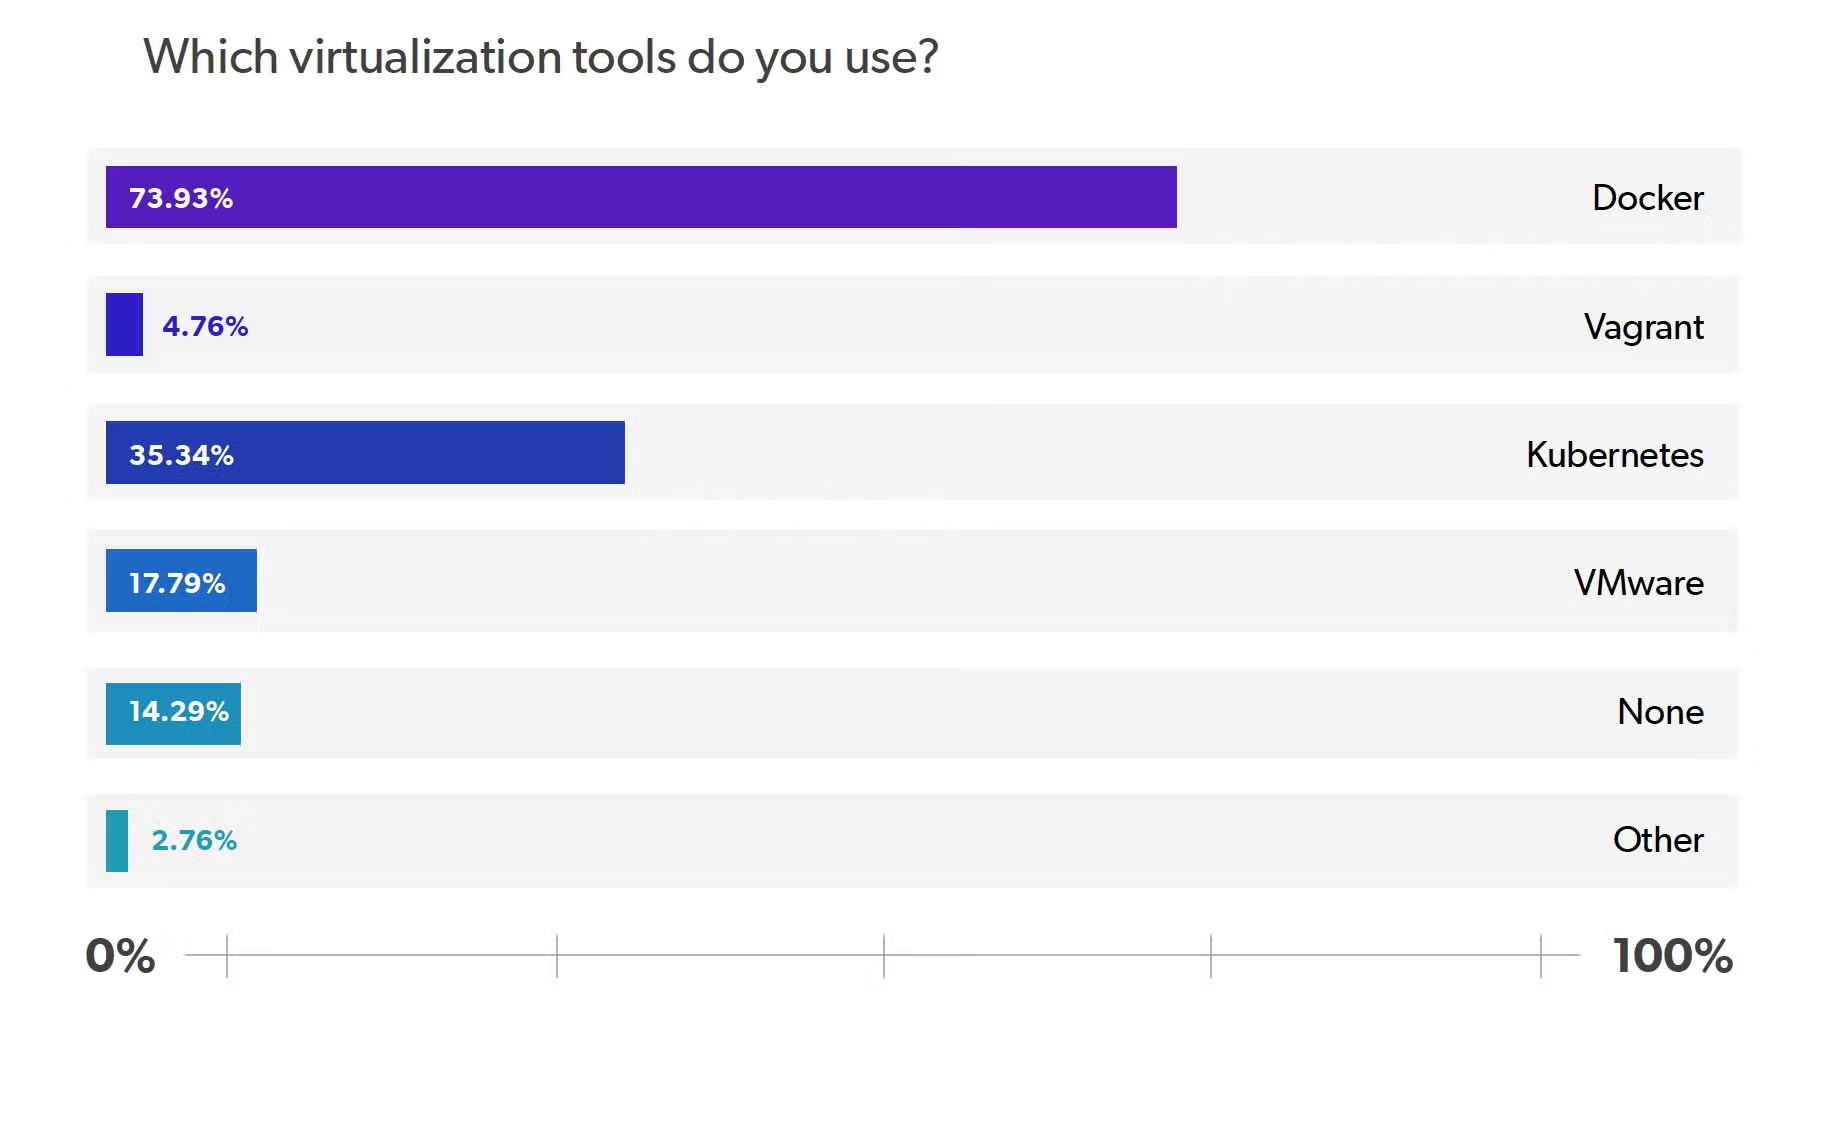
With the way Kubernetes has grown it wouldn’t be surprising to see it play a dominating role in the market in coming years. VMware and Vagrant made up the last two significantly used tools, with 18% and 5% usage respectively. Lastly, 14% of respondents reported not using a virtualization tool.
Back to topFinal Thoughts
Microservices have profoundly impacted the technologies that developers use during application development. And, as companies continue to transition to and create microservices-based applications, we expect technology choices to trend toward facilitating that architecture and the needs of developers working within them.
Want to see a recorded discussion on our 2020 Java developer survey? Our webinar on 2020 trends in Java development is a great one to watch.
Additional Resources
Want to see more insights from our 2020 Java developer report and beyond? You can view the individual report segments, and our new resource collection on changes to Java by clicking the links below.
- 2020 Java Productivity Report
- 2020 Trends in Java Development Webinar
- 2020 Java Productivity Report Overview
- 2020 Java Microservices Report
- Exploring New Features in Java
Or, if you want to see the full report, you can click the button below.