Have you ever looked at what JDK tools are bundled with your installation? There ought to be something useful in there, right, since someone allegedly smart agreed to bundle it in.
In this post, I offer a filtered list of JVM tools that are available in a typical installation of HotSpot Java. We decided to omit security related tools, tools for various RMI, applets, web-start and web-services. Let’s focus on what can be useful during development of normal apps by normal devs. Note, if you're into command line tools in general, not just Java related, there is a post about 5 really useful command line tools.
Back to topOur Favorite Built-in JDK Tools
Not that you asked me, but I believe that software engineering is mostly about solving problems. All those blog posts saying “every child should learn to code” and “pff, math? I’m a programmer and I’m doing so much more than math, have you seen my HTML5 debugger thingy” agree that software engineering is more than writing pieces of prose in specific languages that computers know to understand. Problems our software solves defines us as programmers.
The ultimate advancement for how we tackle problems comes from science, an enhanced, clear mindset and the tools we utilize along the way.

Now, just to reiterate, below is not a full list of JDK tools, but we want to give you even better distilled version. Here are some examples of development tools in JDK in action.
Back to top
0. javap (Java Class Disassembler)
The most useful variation of flags that you can pass to the javap - the Java Class Disassembler is the following:
- -l - print line and local variable
- -p - print information about non-public items as well
- -c - print method bytecode
For example in the famous “Do you really get Classloaders?” presentation, when an NoSuchMethodException occurs, we investigate what members the class actually has, we execute: javap -l -c -p Util2 and get all the info about the class we’re looking for.
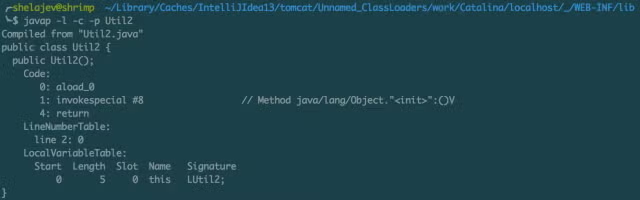
For debugging what do your classes look like or just for gazing at random bytecode sequences, javap is a great tool to have.
Back to top
1. jjs
You get a JavaScript console that you can use as a calculator or to test the weirdness of JS by executing random JS strings. Never let another JavaScript puzzle catch you unprepared!
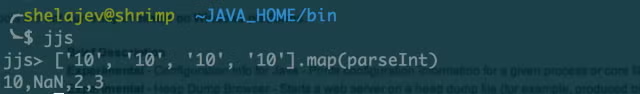
Huh, did you see that coming? But JavaScript is a topic for another time, just know that with jjs you can always check how it works, even if you don’t have node.js or a browser at hand.
Back to top
2. jhat (Java Heap Analysis Tool)
The Java Heap Analysis Tool (jhat) and is used exactly how it's described: a heap dump analyzer. In our small jhat example, we’ll generate that by causing an OutOfMemoryError and supplying a -XX:+HeapDumpOnOutOfMemoryError option of the Java process, so it will produce a file for us to analyze. Causing an OutOfMemoryError is easy (most of the time we do it without wanting to!), we’ll just continuously generate garbage without allowing the garbage collector to intervene:
public class OhMyMemory {

 private static Map<String, Integer> map = new HashMap<>();

 public static void main(String[] args) {
   Runtime.getRuntime().addShutdownHook(
     new Thread() {
       @Override
       public void run() {
         System.out.println("We have accumulated " + map.size() + " entries");
       }
     }
   );
   for(int i = 0; ;i++) {
     map.put(Integer.toBinaryString(i), i);
   }
 }
}
When we run this snippet, it produces the following output:
org.shelajev.throwaway.jdktools.OhMyMemory
java.lang.OutOfMemoryError: Java heap space
Dumping heap to java_pid5644.hprof ...
Heap dump file created [73169721 bytes in 0.645 secs]
Exception in thread "main" java.lang.OutOfMemoryError: Java heap space
at java.util.HashMap.resize(HashMap.java:703)
at java.util.HashMap.putVal(HashMap.java:662)
at java.util.HashMap.put(HashMap.java:611)
at org.shelajev.throwaway.jdktools.OhMyMemory.main(OhMyMemory.java:24)
at sun.reflect.NativeMethodAccessorImpl.invoke0(Native Method)
at sun.reflect.NativeMethodAccessorImpl.invoke(NativeMethodAccessorImpl.java:62)
at sun.reflect.DelegatingMethodAccessorImpl.invoke(DelegatingMethodAccessorImpl.java:43)
at java.lang.reflect.Method.invoke(Method.java:483)
at com.intellij.rt.execution.application.AppMain.main(AppMain.java:134)
We have accumulated 393217 entries
Great success, we have a file now. Let’s aim jhat at it and start the analysis. Jhat crunches the file and spins off a http server for us to get the results.
shelajev@shrimp  ~/workspace_idea/throwaway
$ jhat java_pid5644.hprof
Reading from java_pid5644.hprof...
Dump file created Thu Aug 14 14:48:19 EEST 2014
Snapshot read, resolving...
Resolving 1581103 objects...
Chasing references, expect 316 dots...
Eliminating duplicate references........
Snapshot resolved.
Started HTTP server on port 7000
Server is ready.
Visiting http://localhost:7000 reveals the webpage with links to the data.
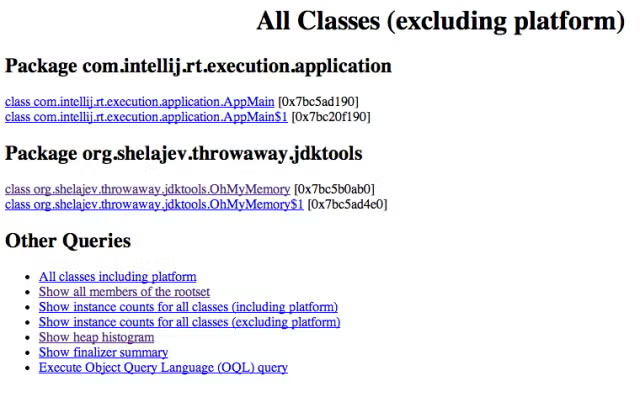
And from there we can look at, for example, the Heap Histogram to figure out what is eating our memory.
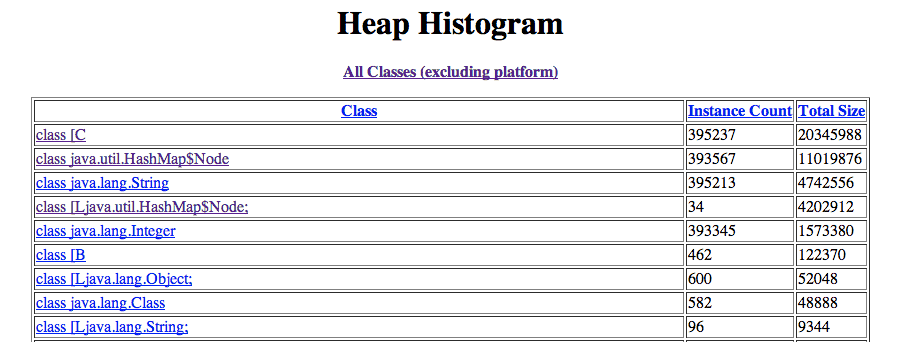
Now it’s clear that our HashMap with 393567 nodes is what crashes the program. There are more useful tools to check the layout of memory in use and analyze the heaps. However, jhat is built in, always available and is a good starting point for any analysis.
Back to top
3. jmap (Memory Map)
Jmap is a memory mapping JDK tool that provides another way to obtain heap dumps without the need to cause any OutOfMemoryErrors. Let’s change the above program a bit to show jmap in action:
public class OhMyMemory {

 private static Map<String, Integer> map = new HashMap<>();

 public static void main(String[] args) {
   Runtime.getRuntime().addShutdownHook(
     new Thread() {
       @Override
       public void run() {
         try {
           System.out.println("Enter something, so I'll release the process");
           System.in.read();
           System.out.println("We have accumulated " + map.size() + " entries");
         }
         catch (IOException e) {
           e.printStackTrace();
         }
       }
     }
   );

   for(int i = 0; i < 10000 ;i++) {
     map.put(Integer.toBinaryString(i), i);
   }
 }
}
Note that now we don’t consume a humongous amount of memory, but finish early and just sit in the shutdown hook not allowing the JVM to exit. This allows us to connect to this program’s process with jmap and get the precious memory dump. So there are two very useful things you can do with jmap, getting the summary of a heap and triggering a heap dump. So when I execute: jmap -heap 1354, where 1354 is the id of the Java process running the code above, I get nice info about the memory usage:
shelajev@shrimp  ~/workspace_idea/throwaway
$ jmap -heap 1354
Attaching to process ID 1354, please wait...
Debugger attached successfully.
Server compiler detected.
JVM version is 25.0-b70

using thread-local object allocation.
Parallel GC with 4 thread(s)

Heap Configuration:
   MinHeapFreeRatio         = 40
   MaxHeapFreeRatio         = 70
   MaxHeapSize              = 67108864 (64.0MB)
   NewSize                  = 1572864 (1.5MB)
   MaxNewSize               = 22020096 (21.0MB)
   OldSize                  = 45088768 (43.0MB)
   NewRatio                 = 2
   SurvivorRatio            = 8
   MetaspaceSize            = 21807104 (20.796875MB)
   CompressedClassSpaceSize = 1073741824 (1024.0MB)
   MaxMetaspaceSize         = 17592186044415 MB
   G1HeapRegionSize         = 0 (0.0MB)

Heap Usage:
PS Young Generation
Eden Space:
   capacity = 1048576 (1.0MB)
   used     = 628184 (0.5990829467773438MB)
   free     = 420392 (0.40091705322265625MB)
   59.908294677734375% used
From Space:
   capacity = 524288 (0.5MB)
   used     = 491568 (0.4687957763671875MB)
   free     = 32720 (0.0312042236328125MB)
   93.7591552734375% used
To Space:
   capacity = 524288 (0.5MB)
   used     = 0 (0.0MB)
   free     = 524288 (0.5MB)
   0.0% used
PS Old Generation
   capacity = 45088768 (43.0MB)
   used     = 884736 (0.84375MB)
   free     = 44204032 (42.15625MB)
   1.9622093023255813% used

981 interned Strings occupying 64824 bytes.
Also it might be easier just to trigger the dump and analyze that later at your leisure. To do that, pass the -dump flag to jmap, like in the example below:
shelajev@shrimp  ~/workspace_idea/throwaway
$ jmap -dump:live,format=b,file=heap.bin 1354
Dumping heap to /Users/shelajev/workspace_idea/throwaway/heap.bin ...
Heap dump file created
Now you have the dump file heap.bin, which you can feed to a memory analyzer of your choosing.
Back to top
4. jps (Java Process Status)
Jps is a process status tool that is most commonly used to determine process ID (PID) of the Java process. It works in an OS-independent way and is really convenient. Imagine that we have started the program above and want to connect to it with jmap. For that we need a PID and that is the exact scenario where jps comes to the rescue. Let's look at an example of jps in action:
shelajev@shrimp  ~/workspace_idea/throwaway
$ jps -mlv
5911 com.intellij.rt.execution.application.AppMain org.shelajev.throwaway.jdktools.OhMyMemory -Xmx64m -Didea.launcher.port=7535 -Didea.launcher.bin.path=/Applications/IntelliJ IDEA 14 EAP.app/Contents/bin -Dfile.encoding=UTF-8
5544  -Dfile.encoding=UTF-8 -ea -Dsun.io.useCanonCaches=false -Djava.net.preferIPv4Stack=true -Djsse.enableSNIExtension=false -XX:+UseConcMarkSweepGC -XX:SoftRefLRUPolicyMSPerMB=50 -XX:+HeapDumpOnOutOfMemoryError -Xverify:none -Xbootclasspath/a:../lib/boot.jar -Xms128m -Xmx750m -XX:MaxPermSize=350m -XX:ReservedCodeCacheSize=225m -XX:+UseCompressedOops -agentlib:yjpagent=probe_disable=*,disablealloc,disabletracing,onlylocal,disableexceptiontelemetry,delay=10000,sessionname=IntelliJIdea14 -Didea.java.redist=NoJavaDistribution -Didea.home.path=/Applications/IntelliJ IDEA 14 EAP.app/Contents -Didea.paths.selector=IntelliJIdea14
5930 sun.tools.jps.Jps -mlvV -Dapplication.home=/Library/Java/JavaVirtualMachines/jdk1.8.0.jdk/Contents/Home -Xms8m
We find that the combination of flags “-mlv” works the best in most cases. It print out main method args, full package names and arguments given to the JVM. This makes quite easy to identify the process you need even among similar ones.
Back to top
5. jstack (Stack Trace)
Jstack is a utility to produce threads’ stacktraces of a given JVM process. If you think there is a deadlock and just want to verify what your threads do while you’re shown that progress bar, jstack is for you. There are just a couple of options that jstack can accept, so when you’re in doubt throw all of them in. Later you can always limit the output, when you can see what information is less useful. Useful options include -F to force the dump, which can be used on hang processes, -l to print info about synchronisation and locks. Here's an example of jstack in action
shelajev@shrimp  ~/workspace_idea/throwaway
$ jstack -F -l 9153
Attaching to process ID 9153, please wait...
Debugger attached successfully.
Server compiler detected.
JVM version is 25.0-b70
Deadlock Detection:

No deadlocks found.
….
The output above is cut for brevity, but it originally contains information about in which state every thread is and what's its current stack trace.
"Jstack is extremely useful, we are using that extensively, especially on our test engine that is responsible for starting / stopping the application servers we test with. Things often go wrong and it gives us the insight to what JVMs are doing when there are no visible side-effects."
-Neeme Praks, Senior Product Engineer at ZeroTurnaround
Back to top
What else?
Today we looked at the amazing tools that are prebundled with your JDK distribution. Trust me, chances are one day you'll need some of them. So when you have a minute, go over their official documentation. Try them in various scenarios and learn to love them. In case you'd like to learn more about some awesome tools for development that AREN'T baked into the JDK, you can look into JRebel.
Want to add more efficiency to your Java development practice? Eliminate redeploys with JRebel. Start your 14-day free trial today.
Back to top
Bonus Section: References
Below you'll find a more complete list of JDK tools that are available for you. Even this is not a complete list; to save space and electronic trees, we omitted cryptography, web-services related tools etc. Thanks to manpagez.com for the resource!
- jar - an utility to Create and manage Java Archive (JAR) files
- java - the launcher for Java applications. In this release, a single launcher is used both for development and deployment.
- javac - the compiler for the Java programming language.
- javadoc - API documentation generator.
- javah - C header and stub generator. Used to write native methods.
- javap - class file disassembler
- jcmd - JVM Diagnostic Commands tool - This JVM tool sends diagnostic command requests to a running Java Virtual Machine.
- jconsole - a JMX-compliant graphical tool for monitoring a Java virtual machine. It can monitor both local and remote JVMs. It can also monitor and manage an application.
- jdb - Java Debugger.
- jps - JVM Process Status Tool - This JVM tool lists instrumented HotSpot Java virtual machines on a target system.
- jstat - JVM Statistics Monitoring Tool. This JVM tool attaches to an instrumented HotSpot Java virtual machine and collects and logs performance statistics as specified by the command line options.
- jhat - Heap Dump Browser - Starts a web server on a heap dump file (for example, produced by jmap -dump), allowing the heap to be browsed.
- jmap - Memory Map for Java - Prints shared object memory maps or heap memory details of a given process or core file or a remote debug server.
- jsadebugd - Serviceability Agent Debug Daemon for Java - Attaches to a process or core file and acts as a debug server.
- jstack - Stack Trace for Java - Prints a stack trace of threads for a given process or core file or remote debug server.
- jjs - Runs the Nashorn command-line script shell.
- jrunscript - Script shell for Java - Runs a script. This tool is unsupported and experimental in nature and should be used with that in mind. It might not be available in future JDK versions.