In our Java Tools & Technologies Landscape for 2014, over 2000 developers told us a bit about what JVM technologies they use and which tools are interesting to them.
So we wanted to do the same with IDEs, but realized that we had so much awesome data that we needed to continue to break it down into separate tool segments from there!
So why does it make sense to segment by IDE?
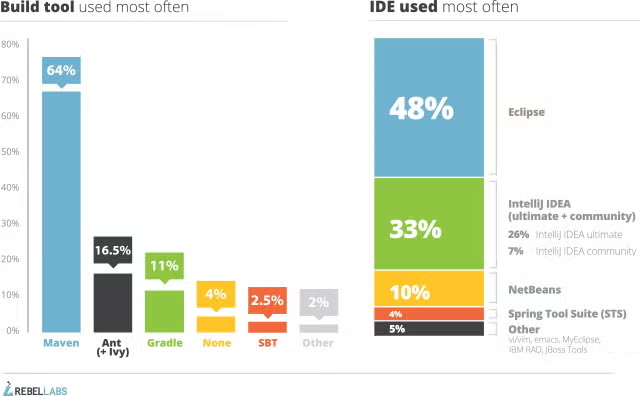
- 97% of developers surveyed use an IDE
- Most developers use only 1 IDE exclusively.
- Most developers use the same IDE for a long time.
These factors lead us to believe that you can potentially learn something about developers based on the IDE they use (or choose). What we’ve done is extracted data for each IDE users and compared it to the average using Microsoft Excel pivot tables. What we are seeing is how a specific IDE users compare to the entire survey population, and seeing if anything significant can be seen. Let’s get into it, starting with Build Tools…
Looking for the latest info on Java IDE usage? Our 2025 Java Developer Productivity Report looks at the most-used IDEs, build tools, frameworks, application servers, and more.
 Back to top
IDEs vs. Build Tools
Given the deep integration and love-hate relationship between users of different IDEs and build tools, we thought about starting here and covering Eclipse, IntelliJ IDEA and NetBeans, which comfortably take up over 90% of the IDE market. Other tools, like Spring Tools Suite, MyEclipse, IBM RAD, JBoss Dev Studio, vi/vim, emacs, etc didn’t make up significant portions of the overall community, so to make things simpler we didn’t cover them at this time.
Back to topEclipse vs. IntelliJ Market Share
Currently, the battle for IDE market share is firmly Eclipse vs IntelliJ, with Eclipse being used by 48% of our survey respondents and IntelliJ IDEA Ultimate and IntelliJ IDEA community combined users at 33%. Our survey found that users of Eclipse and IntelliJ comprise 81% of the overall IDE market share, with NetBeans being the third most popular at a 10% market share.
Eclipse (48% IDE market share)
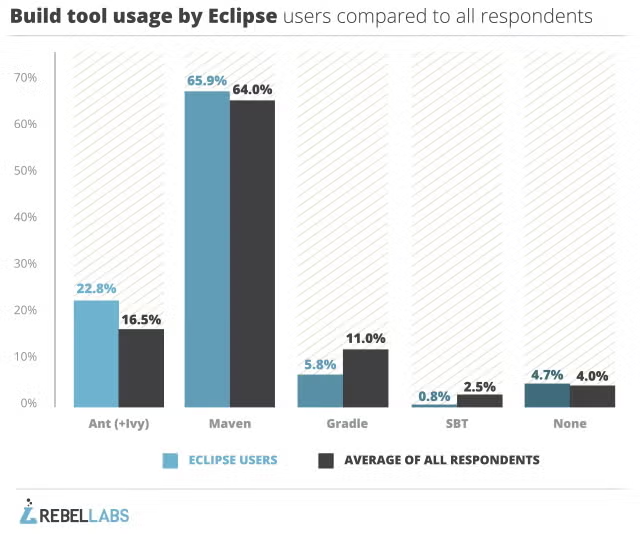
As the most commonly-used IDE at 48% (when increases to 55% when including distributions like Spring Tool Suite, MyEclipse and JBoss Dev Studio), we expect Eclipse statistics to more or less mirror the average. However, we can see a few differences when compared to the entire survey population. Most noticeable are:
- Ant (+/- Ivy) usage (22.8%) by Eclipse users is significantly higher than the average (16.5%), giving them highest % of Ant users in the industry. In light with Ant’s visible decline in use that we’ve seen over the last years, this indicates that Eclipse projects are frequently mature.
- Maven usage is very aligned with the average—also, the % of respondents using No Build Tool is also quite close to the average.
- Usage of Gradle (5.8%) and SBT (0.8%) by Eclipse users is considerably lower than the average, which is 11% and 2.5% respectively. This may indicate that Groovy and Scala users are perhaps choosing another IDE…
IntelliJ IDEA (33% IDE market share)
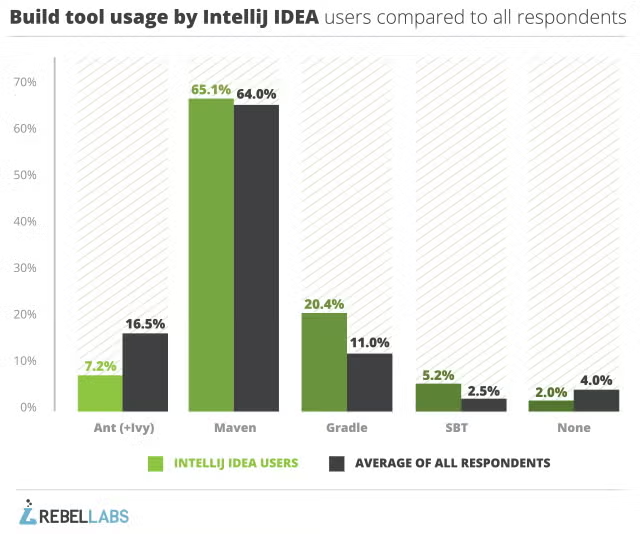
Our survey distinguished between IntelliJ IDEA Community Edition (free) and IntelliJ IDEA Ultimate Edition ($$$), and for the sake of the graphics we combined the weighted scores for both versions. IntelliJ IDEA is the fastest growing IDE in the market, and according to 49% of respondents, the "most interesting" IDE available. Here is what we see here:
- Gradle usage (20.4%) by IntelliJ IDEA users overall is nearly double the average (11%), which shows a clear preference for newer technologies and dabbling with alternative JVM languages, like Groovy.
- SBT usage (5.2%) by IntelliJ IDEA users overall is over double the average, and it skyrockets to a whopping 11.6% for IntelliJ IDEA Community Edition users, indicating a taste for Scala.
- Compared to the average for No Build Tool (4%), this choice is less common among IntelliJ IDEA users (2%) than any other IDE. The only build tool less popular for IntelliJ IDEA users than “none” is actually Ant (+/- Ivy) (7.2%), which drops more than 50% in usage compared to the average (16.5%).
NetBeans (10% IDE market share)
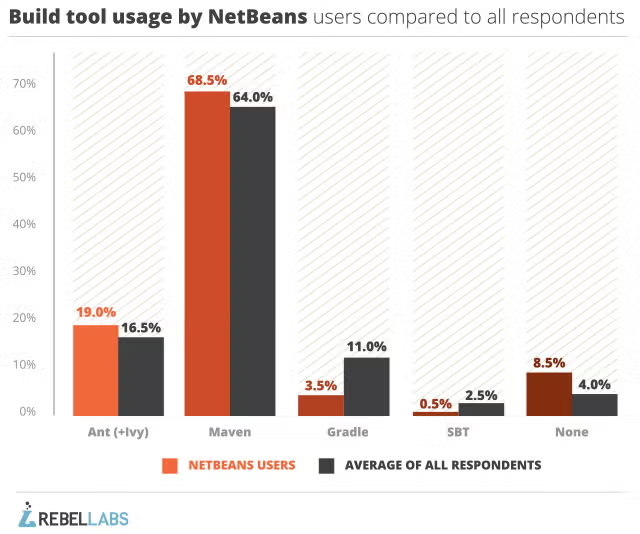
NetBeans remains in a stable third place in the market, using its proximity to Java and Oracle to its advantage when possible, most recently in the same-day launch of NetBeans 8 to fully support Java 8, and continued easy integration with GlassFish as the reference implementation for Java EE 7. Here's what we see when it comes to NetBeans users:
- Similar to Eclipse, Ant (+/- Ivy) usage (19%) by NetBeans users is raised compared to the average (16.5%), as is Maven usage (68.5%) compared to the average (64%). The indication points to greater project maturity with NetBeans users.
- Adoption of Gradle (3.5%) and SBT (0.5%) compared to the average for all respondents (11% and 2.5%, respectively) is considerably lower, indicating a lack of affinity for newer tools and alternative JVM languages.
- The biggest surprise is the number of NetBeans users who selected No Build Tool (8.5%), which is nearly double the average.
Back to top
Concluding Remarks (TL;DR)
Eclipse
Eclipse users significantly favor Ant (+ Ivy), where usage is highest among all IDE users, and Maven is aligned with the average. But Eclipse developers are less likely to use alternative build tools like Gradle and SBT. This indicates to me that Eclipse represents the vast majority of legacy enterprise projects out there.
IntelliJ IDEA
IntelliJ IDEA developers use Ant (+ Ivy) about half as much as the average, Maven is consistent and usage of newer alternative build tools like Gradle and SBT is nearly double the average. They are also the most likely developers to use any one of the build tools out there. This implies that IntelliJ IDEA users are more cutting edge and less willing to use legacy tools in favor of alternative solutions.
NetBeans
Ant (+ Ivy) and Maven usage among NetBeans developers is slightly higher than the average, which explains the lower numbers for Gradle or SBT. NetBeans users are more likely to ditch the build tool entirely than any other IDE users. This indicates to me that regardless of what NetBeans projects are up to, they need less tooling than other devs (because they got mad skills?).
Get Started With JRebel
Give JRebel a test spin with a free 14-day trial—and see how much you can save by calculating your ROI.