Blog
November 29, 2015

As with all problems which have many solutions, it can often be tricky to determine which is the best solution for you. What works for other people may not work for you. When it comes to Java profilers, there are many on the market, and it’s often tough to determine what the differences are and which is best for your application. Even then, profiling a Java application can be difficult. That's why in this blog we look at the top five java profilers, while answering the following questions:
- Which Java profiler tools find the highest number of bugs?
- Should I be using more than one Java profiler?
Which Java Profiler Is Best?
Discover how JRebel compares to JProfiler and YourKit.
Looking for the latest Java technology usage stats? Our 2021 Java Developer Productivity Report provides insights on the most popular Java technologies, including frameworks, application servers, JDK distributions, and more.
Back to top
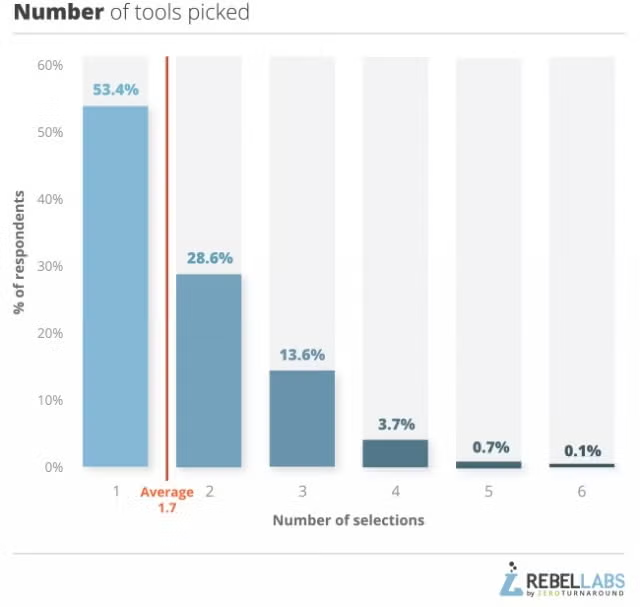
Almost Half (46.6%) of Survey Respondents Use Multiple Java Profilers
Earlier this year, we released our annual Developer Productivity report. It was based off a performance survey which collected responses from over 1500 developers, testers, architects, and many more interestingly named job titles. The great news is we gave $0.50 for every completed survey to a great charity called Dogs for Good (formerly Dogs for the Disabled), which provide assistance dogs to disabled children.
What Is Java Profiling?
Java profiling is the dynamic analysis of the execution of a Java application, including memory utilization, speed and frequency of function calls, and more.
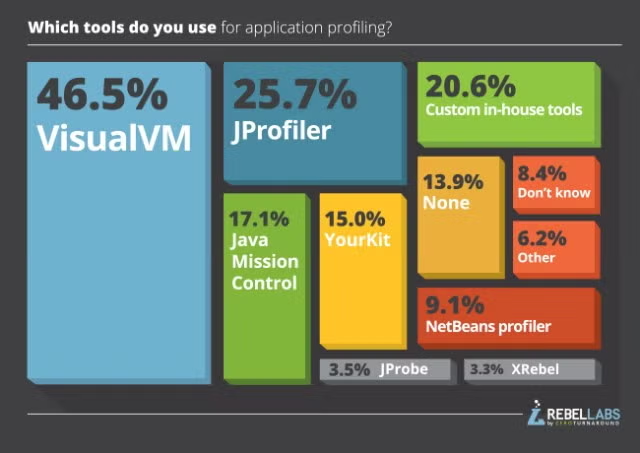
The wily among you will have noticed that the first image in this blog contains percentages which do not add up to 100%. The reason for this isn’t basic math incompetence. No, not this time. This time it’s because the question allowed for multiple choice answers, in case people tended to use more than one profiling tool on their applications. It turns out that it was very common for teams to use multiple tools when profiling a Java application, as each tool tends to be better in certain phases or the application lifecycle, or perhaps preferable when chasing down a particular type of performance bug.
 Back to top
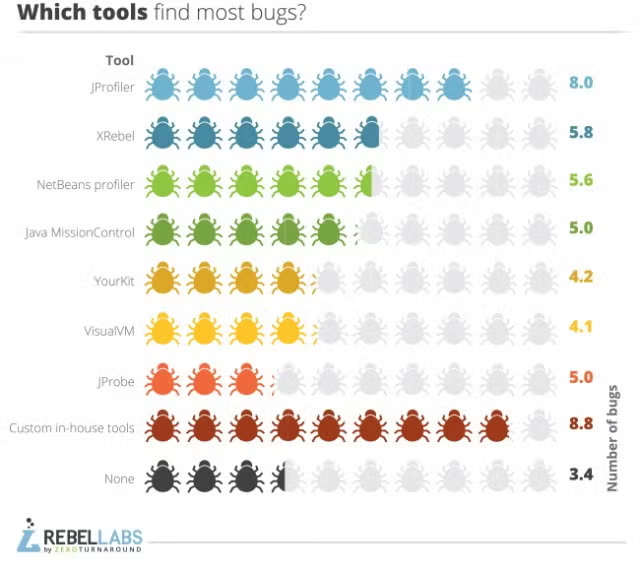
Want to Find Bugs? Roll Your Own!
Most performance bugs were found by custom in-house JVM profiler tools. This might be because those who write the custom tools work with very particular applications and have the specific application knowledge to expose certain bugs that other tools may not. We might also be able to infer that if a team were able to write their own in-house performance tools, they are likely to be closer to the nirvana that is a performance expert. As such they would be able to find more performance bugs than others anyway.
Tools which did very well include JProfiler, XRebel (which is more than a profiler actually), NetBeans profiler, JMC, and JProbe. From our personal point of view, it was really exciting to see XRebel finding some of the most bugs out of any tool. This may well be because it is designed to be used in development, a place where it’s easier to find and eliminate bugs.
 Back to top
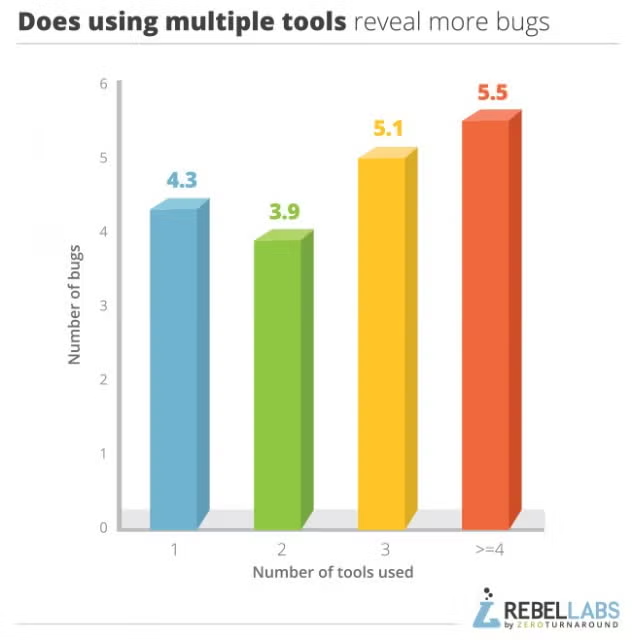
Can You Really Blame Your Tools?
Well, from the graph below, you might be able to blame not having enough tools, as there’s a definite trend showing that you can find more performance issues if you use multiple tools. This helps to show there is a right tool for the right job. The job, however, may vary, for instance, you might be trying to find and fix specific types of IO issues or code bottleneck. You might have a preferred tool for each of those tasks. You might want to use JMC in production, but XRebel in development as each tool is better suited to different environments.
 Back to top
What Are the top Java Profilers?
The top five Java profilers are:
- VisualVM
- JProfiler
- Custom tooling
- Java Mission Control
- YourKit
Let’s take a look at them in a little more depth. Oh, we’ll also give an honorable mention to XRebel, the performance tool for Java developers, taking over 3% of the votes, which wasn’t even a year old at the time the survey was released! We’ll look through our top 5 Java profiling tools in reverse order of usage for increased tension and suspense, even though you already know which is top!
5. Your Kit (Used by 15.0% of Respondents)
The YourKit profiler is one of the most established leaders among JVM profiler tools. As a mature and a versatile profiler, YourKit can do both CPU and memory profiling for you, with integrations across major Java application servers, JDBC and other frameworks for high-level performance analysis like finding synchronization issues and excessive database accesses. YourKit can run in both sampling and tracing profiling modes, and the mixed approach helps it make the most from both worlds: the precision of tracing the actual code execution while being able to precisely control the profiling overhead.
The memory profiling in YourKit can detect memory leaks and trace the excessive objects back to the GC roots to show you why the objects are not being collected. A memory snapshot comparison and automatic memory snapshot generation when memory is low can help further analyze your application’s heap. With the unique on-demand profiling, you can run the profiled application with approximately zero overhead, activating actual profiling only when it is needed. When the profiler’s capabilities are needed you can always turn the YourKit profiler on, and you can precisely control the overhead that you’re able to tolerate.
YourKit, used by 15% of survey respondents didn’t fare too well on how many performance bugs typically found per release, but it wasn’t too far behind with 4.2 issues on average.
4. Java Mission Control (Used by 17.1% of Respondents)
Java Mission Control is a Java performance monitoring tool by Oracle which has been shipped with the JDK since Java version 7 update 40. It encompasses two JMX Console and Java Flight Recorder. Java Mission Control works by interacting with a JMX agent in a JVM which has an MBean server that integrates with the built in VM and app instrumentation running the in the JVM. That’s a key piece as it does lower the usage cost of the tool as it’s using pre-existing hooks. Oracle state this is normally well below a 1% performance cost.
Flight recorder, with its historical view, provides the ability to see trends in your JVM. This gives you the data needed to find memory leaks, latency issues around thread waits, locking issues and more. The unique feature Java Mission Control brings to the table is that it’s shipped with the Oracle JDK. There’s nothing that you need to install or attach to your existing VM to get it working. Start up a terminal go to your JDK bin directory and just type jmc.
Given Java Mission Control is packaged and shipped with the Oracle JDK, it’s surprising only 17.1% of respondents use it. I would expect the biggest issue around Java Mission Control is awareness. Even today when I ask how many people even know about it less than half of a room at a conference room will put their hands up. The tool fared reasonably well in the survey, finding an average of 5 performance issues per release.
3. Custom In-House Tools (Used by 20.6% of respondents)
If you wanted to write custom tools to test your application, you need to be able to trust their results. To trust your tool’s results, you have to be smart enough to write the tool, taking account of all performance intricacies that existing Java profilers have spent years fine-tuning. Often this is more scenario based testing that writing an actual tool, but 1 in 5 people use their own tooling, which finds more bugs than other profilers.
2. JProfiler (Used by 25.7% of respondents)
JProfiler is a comprehensive Java code profiling tool for Java SE and Java EE applications with plugins for all major IDEs which provides enhanced analysis of the collected profile data. As with any profiler, the CPU profiling is perhaps the most important and useful thing you can get from JProfiler. Additionally, JProfiler can show a call graph view, where the methods are represented by colored rectangles that provide instant visual feedback about where the slow code resides in the method call chains, making bottlenecks easier to find. Memory profiling with JProfiler can also be tuned to get more or less detail, for more data or to help to reduce the performance overhead. It can collect, analyze and render snapshots of the heap created with HPROF.
From our survey, we can see JProfiler is in use by 1 in 4 of our respondents and is the second most heavily used Java profiling tool. It also does particularly well when we look at how many bugs each profiler finds in a release. In fact, it finishes second, only to custom in-house tooling, so is the highest placing third-party profiler in that category.
Comparing JProfiler vs Yourkit, JProfiler is the more used profiler. But in comparing usage for JProfiler vs VisualVM, VisualVM is the more used tool.
1. VisualVM (Used by 46.5% of Respondents)
JVisualVM is an All-in-One Java Troubleshooting tool that takes advantage of several command line tools that are bundled with your JDK distribution and presents the information about your Java process performance in a nice UI. Besides being a lightweight monitoring tool, it offers application developers the ability to properly profile their code execution, collect and browse thread dumps and heap dumps, while gathering various statistics about the internals of the JVM.
One of the most under-appreciated features is the ability to monitor MXBeans, management components that can show you thread pools usage, memory pools statistics, details about the frequency of garbage collection and so on. Typical memory problems like analyzing a heap dump to see what objects take the most of your JVM process memory. While other profilers might offer a more advanced approach to application profiling, VisualVM is the most appropriate first tier tool to analyze the performance of your code. Given that it's bundled with your JDK distribution and is literally just one click away, it's an invaluable tool! No wonder almost one in two developers is using it to either fully profile the application or in conjunction with other profilers to get a good initial impression using VisualVM and perhaps digging deeper with something heavier.
While VisualVM did significantly turn out to be the most popular profiler among our respondents, by usage, the tool struggled more on the number of performance bugs it found. In fact, it was turned out to be the tool which respondents said found fewest bugs in their environment. However as you might expect to use it in addition to other profilers, this may not be as big of an issue as it sounds.
Back to topFinal Thoughts
This was quite a long post, so let’s summarize it in a few sentences.
- People who performance test their application using multiple Java code profiling tools tend to find more performance issues than just using one.
- Visual VM is the most commonly used Java profiler.
- The Java profiling market is fairly well spread across some different tools.
- Custom tools fared very well when respondents reported how many performance bugs they found using them.
- JProfiler and NetBeans profiler find the most performance bugs among our respondents.
I hope you found this post useful! If you did and want more information on profiling a Java application, be sure to check out the full report on one of the button links above. I’ll post a link to it here too so you have no excuse not to look through it!
Looking for more productivity gains? With JRebel, you could save a month of development time annually. See for yourself during your 14-day free trial.
Additional Resources
Looking for additional reading on impactful Java technologies? These resources are worth a look.
- White Paper: 2021 Java Developer Productivity Report
- Blog: Best Java Performance Testing Tools and Technologies
- Blog: Top Java Development Tools and Software