Java performance testing isn't just for testing teams anymore. With the increasing adoption of DevOps methodology — especially as it applies to testing early and often — many companies are making performance testing a responsibility for developers.
In this article, we'll look at the top Java performance tools available today, including Java performance testing tools, tuning tools, and tracing tools that can help identify performance issues.
Back to topWhat Is Java Performance Testing?
Java performance testing is the practice of testing Java code to measure the speed of an application. This extends to response times, resource utilization, scalability, and reliability.
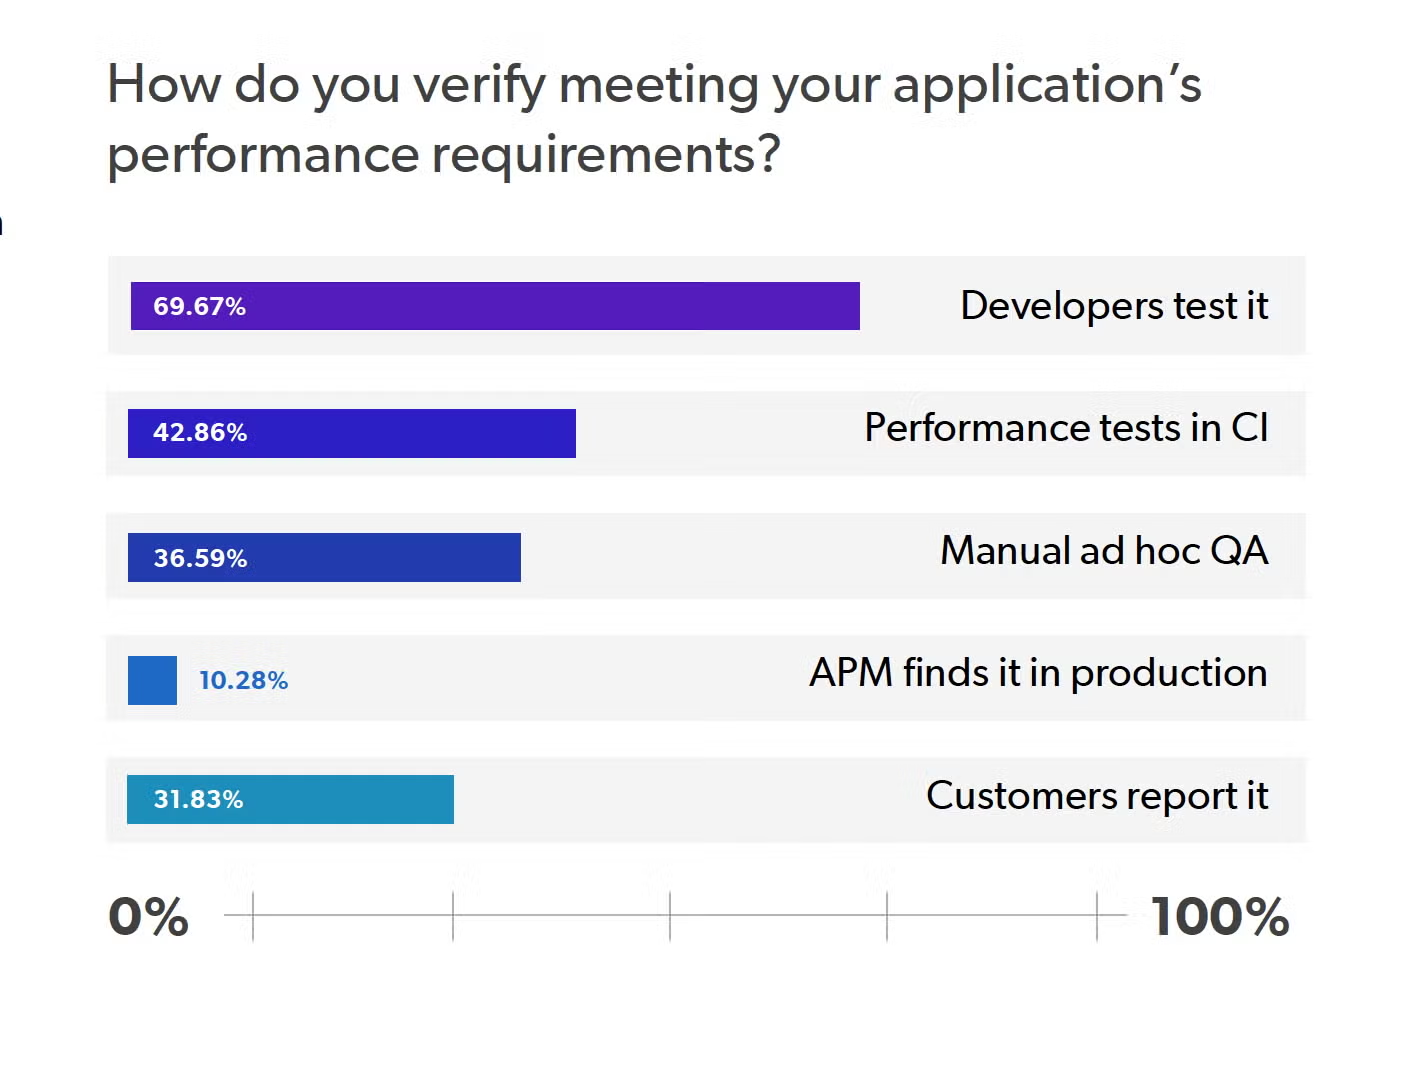
How and when those performance criteria are measured, however, is dependent on the application and underlying technologies being used. In our recent Java developer survey, we found that the method for verifying the performance goals for an application varies from developer testing, to manual ad hoc QA, to end user reports.
For Java developers, performance testing has shifted in two ways: necessity, and complexity. Over half of Java developers now have application performance requirements as part of their development responsibilities, making Java performance testing a crucial component of application development. With the growing prevalence of architectural approaches like microservices, developers are now tasked with assessing more complex applications that possess more intricate (and hard to trace) interactions.
Back to topWhy Is Performance Testing Important?
Performance testing is an important aspect of application development because it helps to ensure applications meet the needs of the end user.
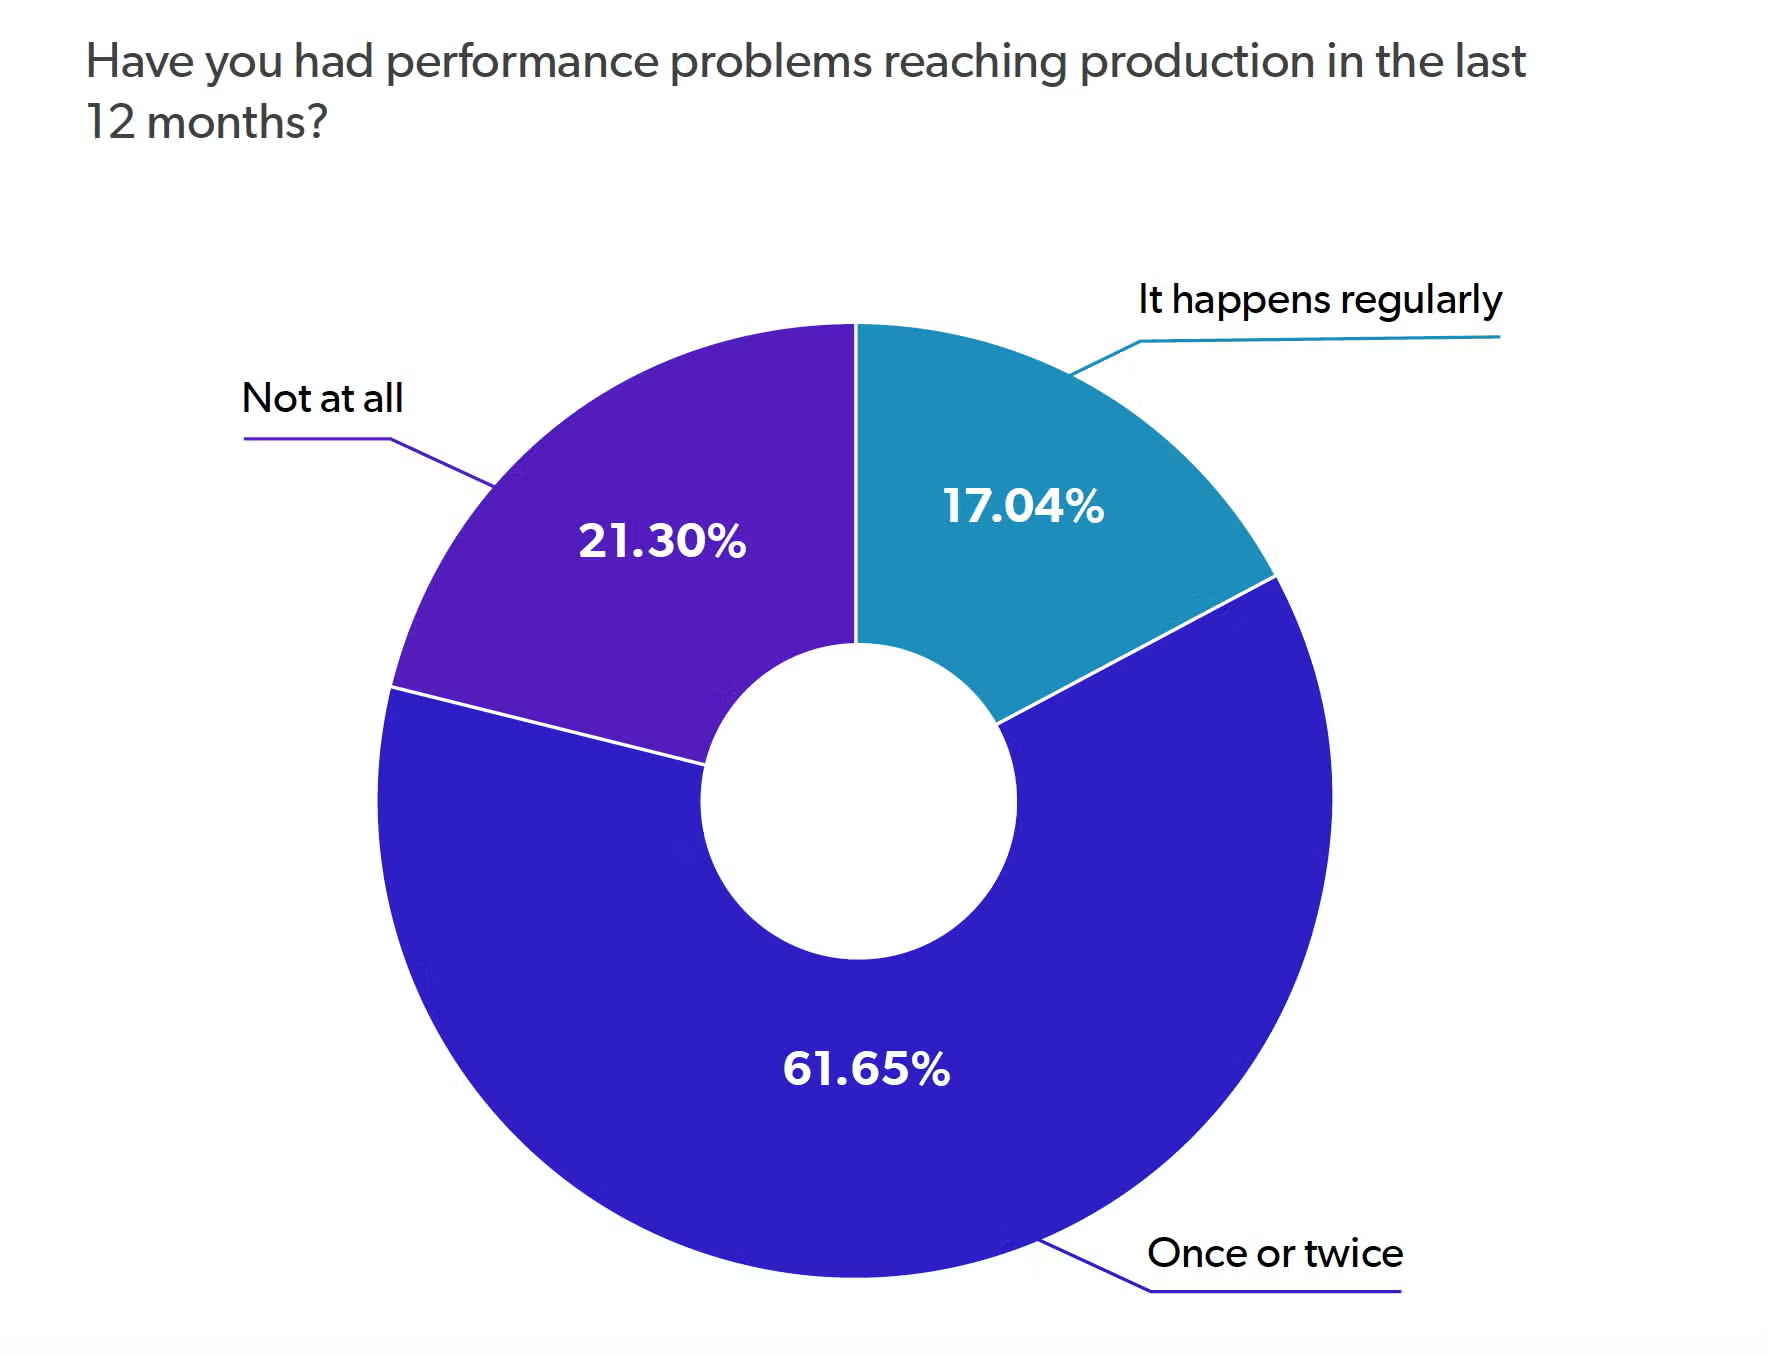
With large quantities of data, users, and the demand for fast, user-friendly experiences, it's clear that application performance testing is more important than ever. Yet, performance issues have a particular knack for reaching production. In fact, our recent Java developer survey found that over 82% of Java developers had performance problems reaching production.
So, what's the answer for Java development teams that want to minimize those performance problems? One, ensure you're doing formalized performance testing. This is typically done via a third party performance monitoring tool or if you are really feeling ambitious, custom-made for your project. Two, identify strategies for each stage of the application lifecycle. This is critical as the sooner you are able to identify issues, the sooner you can address, and the less expensive those performance issues become for your team.
For those interested in formalizing their performance testing processes, the next section will give you a good overview of what's available for performance testing tools. After that, we'll look at a few of the Java performance tuning and tracing tools that can help Java development teams get additional insight without formal tests.
Back to topBest Java Performance Testing Tools
The Java performance testing landscape for developers isn't nearly as barren as it used to be. Part of that is the adoption of DevOps strategies that shift testing further left, and part of it is the maturation and adoption of prevalent technologies like JMeter. While we predominately look at load testing tools for Java applications here, load testing is the basis for most performance testing approaches.
JMeter
JMeter is an open-source tool by Apache used for load and stress testing Java applications. JMeter can be used for many application, server, and protocol types, including both static and dynamic resources. Additionally, it has a variety of extensions that can help to record and visualize the resulting test data.
Because JMeter is widely-used, and open-source, it's very popular within the Java development community.
Gatling
Gatling is an open-source performance testing tool that focuses on load testing. The free version has integrations for Maven, SBT, Gradle, and Jenkins(focusing on local testing environments), while the premium version has integrations for Bamboo, TeamCity, and Grafana (focusing on more complicated CI/CD environments). Also of note, the free version doesn't support distributed applications -- which can be a big detractor.
BlazeMeter
BlazeMeter is a paid tool that allows developers to quickly spin up performance tests for web and mobile applications as well as microservices and APIs. It integrates with popular open-source tools (like the aforementioned JMeter and Selenium) and has a UI that allows for easy and replicable load testing.
While it's a premium product, it's evidently popular for enterprise companies who don't want to commit development resources and money to creating reliable load testing solutions.
Back to topBest Java Performance Tuning Tools
Creating a performant Java application starts with the architect, and ends with the developer making those choices work. Whether that's technical solutions like cache configuration, or optimizing classes to reduce memory consumption, developers need tools that can help identify performance issues during development, and during production.
For the purposes of this exercise, we're looking at one development stage performance tuning tool, and one tool that is primarily used during production.
Stagemonitor
Stagemonitor is an open source application performance monitoring tool. While APM tools like this are typically associated with production, Stagemonitor can be used during development as well. While it does offer some similar features to XRebel during development, the user experience and functionality aren't nearly as polished.
For production performance monitoring, however, Stagemonitor provides robust functionality that make it a popular, free, choice among Java APM tools.
JProfiler
JProfiler by EJ Technologies is another popular Java performance tuning tools used for assessing system performance, profiling threads, and finding memory leaks. Used for performance tuning, developers can identify inefficient memory consumption and use that information to fix the underlying issue.
However, JProfiler (and other profiling tools) have a large overhead – definitely not ideal to be running on most developer machines.
Back to topBest Java Tracing Tools
Java tracing tools are an important component of the performance tuning process. While not a formal testing tool or framework like JMeter, tracing tools allow developers to assess the performance of requests within applications.
With the increased complexity and distributed nature of many Java applications, finding a reliable and user-friendly distributed tracing tool is a big part of developing a performant Java application. In the list below, we look at a few of our favorites.
XRebel/JRebel
When it comes to discovering performance issues in Java applications and fixing those issues, the combination of XRebel and JRebel may be the best option available. XRebel allows developers to check request performance end to end to discover performance issues during development. Then, once the developer is ready to make the change, JRebel allows the developer to skip the redeploy process and see that change instantly. Then, with XRebel, the developer can see whether or not the change had the desired performance impact.
With the average Java developer spending hours each week waiting on redeploys, that can mean more efficient performance improvements and faster time to market. Add recent improvements to the Eclipse and IntelliJ plugins that allow the two tools to be used simultaneously via the IDE, and XRebel/JRebel are a must-have combination for Java developers.
Zipkin
Zipkin is a distributed tracing system that allows developers to troubleshoot performance issues in distributed service architectures. The main features that set Zipkin apart from other tracing tools is its ability to both search for trace criteria via log file ID, service, operation name, and even duration. The diagramming feature is also nice because it helps developers to visualize traces via a dependency diagram.
Zipkin has transitioned into open source with OpenZipkin.
Stackify Prefix
Stackify Prefix is another option for Java tracing tools. In addition to helping developers trace distributed requests, it offers code improvement suggestions for easy fixes. There are two versions of Prefix, with the premium version providing features that make it comparable to XRebel. On the APM side, Stackify also has a paid APM solution called Retrace.
Back to topFinal Thoughts
Today, Java developers have a bevy of performance testing tools that can help them test and improve performance during development. But even with these tools, the complexity and lack of visibility into modern Java applications means that performance issues can easily find their way to production.
Looking for more information on the latest technologies Java developers are using most in, including frameworks, application servers, Java versions, etc.? Get the latest data in the 2025 Java Developer Productivity Report.
Additional Resources
Looking for additional reading on performance testing Java applications? The resources below are a good place to dive in.
- Performance Test Web Services Using JMeter
- Performance Testing With Open Source Tools: Busting The Myths
- JMeter Tutorial: Getting Started With the Basics
- Developer's Guide to Microservices Performance
- How to Find Microservices Performance Issues
- JUnit Cheat Sheet
- Challenges to Mobile App Performance Testing
- Performance Testing Metrics: How to Reveal Your Metrics
- API Performance Testing Tools: JMeter, Taurus, and BlazeMeter
- Gatling + Grafana + InfluxDB: Your Ideal Monitoring Combo