 Blog
Blog What's New in Java 26: New Features, Changes, and What Comes Next
Java 26 ships with ten JEPs, across five categories: core Java library, HotSpot, Java language specification, security library, and client library. Together, these JEPs add new functions and capabilities to the Java language. Read this blog post for a breakdown of the incubator, preview, and permanent JEPs included in JDK 26.
Java Updates
 Blog
Blog What Java Developers Need to Know About the Migration from SAP Hybris to SAP Commerce Cloud
SAP Hybris (now known as SAP Commerce) is set to reach end of life (EOL) on July 31, 2026. Read this blog for a summary of how the migration will impact Java developers — and what to do about it.
Java Application Development
 Blog
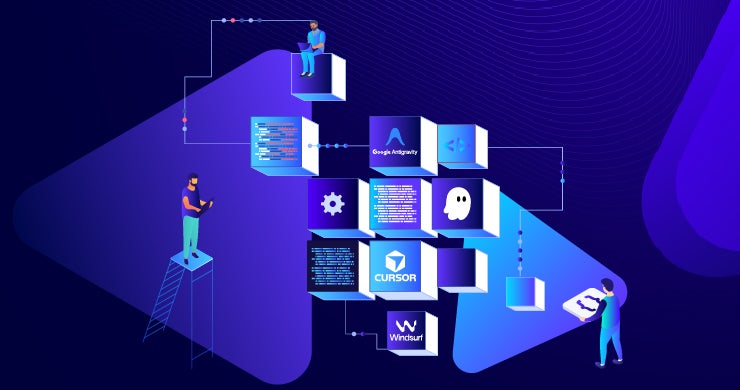
Blog Java Basics: Your Guide to AI in Java IDEs
There are advantages to both AI plugins for IntelliJ, VS Code, and Eclipse, and AI-native IDEs like Cursor, Windsurf, Kiro, and AntiGravity — it all comes down to your organization’s Java development needs. The good news is that JRebel can eliminate Java redeploys in all popular Java IDEs.
Developer Productivity


 Blog
Blog Exploring IBM WebSphere Application Server
Is IBM WebSphere the right application server for your organization and your needs? Curious about the features, benefits, and drawbacks of this commonly used platform? This blog covers all the details so you have the information you need in one convenient place.
Java Application Development
 Blog
Blog Tips for Java Developers to Overcome Cloud Complexity Challenges
Cloud development has removed the burden of managing servers and scripts, but it has also introduced new productivity challenges, such as slow redeployments, JVM startup latency, and complex dependency management. How can you overcome these issues to reduce complexity and boost productivity? Read on to find out.
Developer Productivity