Our 2021 Microservices Developer Report is based on findings from our 2021 Java developer productivity survey. The survey, which collected responses from 876 Java development professionals from around the globe, provides valuable insights into how Java development teams are using languages, tools, and technologies.
Back to top2021 Microservices Developer Survey Results
With the continued focus on microservices in the Java community through the last several years, we centered a section of the report on microservices to assess growth, usage, and challenges. The first question we asked determined the prevalence of microservices in the Java developer community.
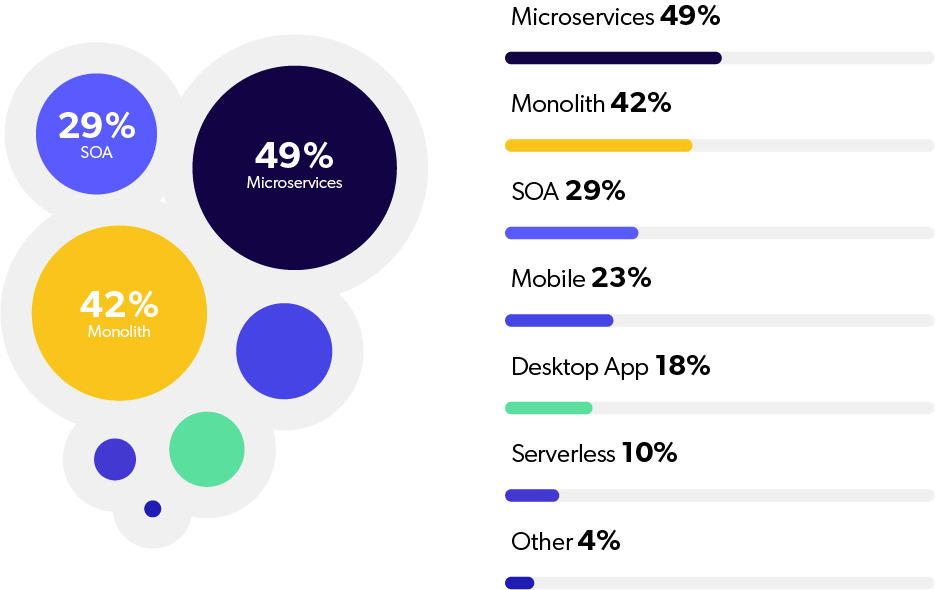
Java Application Architecture
Our survey found that 49% of respondents are using microservices as the architecture for their main application(s). While this seems like a large amount, monolith architecture was a close second at 42% of respondents.
This is a shift from last year’s survey, in which 50% of respondents were using microservices and only 27% were using monolith. In addition, SOA usage has grown from almost 10% to 29%. Closely following are mobile at 23% and desktop app at 18%.
What this means: These survey results may indicate a stall in microservices adoption this year. This could be due to COVID-19 concerns or a signal that microservices adoption has become less of a priority within the Java community. As we all know, it is expensive to transition application architecture and may have proved more painful to make these transitions.
Engineers are additionally recognizing the lack of need to transition to microservices for all of their application and rather are focusing on specific parts of the application as microservices while other parts maintain the monolithic architecture.
Back to topJava Microservices Adoption
While microservices usage has dropped from last year, microservices adoption is not far from mind for many developers. We found that nearly 66% of respondents are either working in or actively transitioning to microservices. This is a slight increase over last year, where 63% of respondents fit into those two categories.
An additional 21% said they are actively talking about adopting microservices. Only 13% of respondents do not have microservices in their plans at all.

What this means: Although microservices usage has slowed, we can expect an uptick in adoption over the next year. As companies regain momentum from 2020 and start a new fiscal year, they could decide to invest in microservices.
Back to topMicroservices Usage
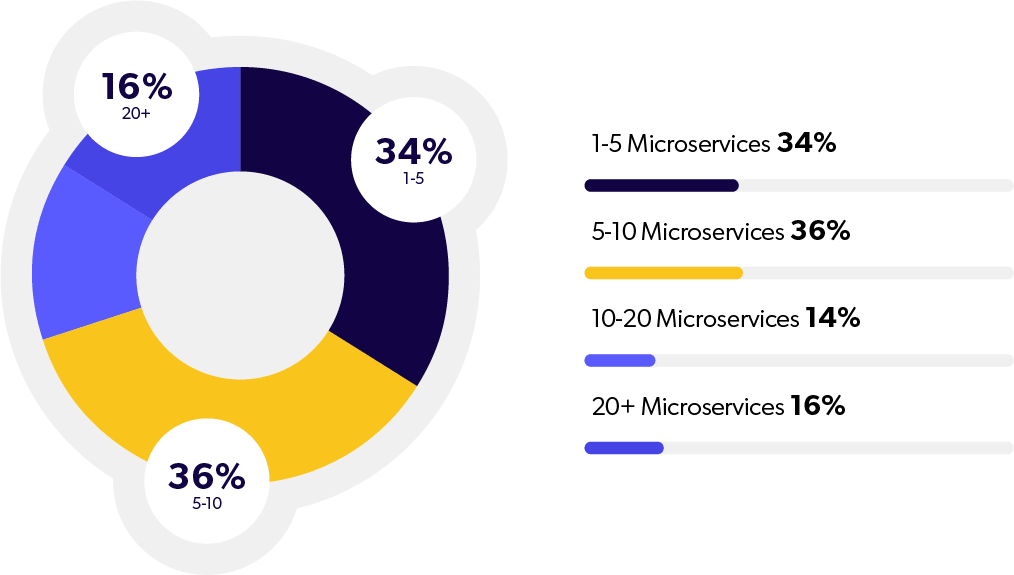
For those using microservices, we asked how many microservices they have in their primary application. Answers were provided on a scale of one microservice to more than 20 microservices.
The most common responses were 5-10 microservices and 1-5 microservices at 36% and 34%, respectively. Trailing answers include 10-20 microservices (14%) and 20+ microservices (16%).
What this means: We found this to be interesting feedback. Because more than a third of our respondents say they work with enterprise applications, it’s surprising that there aren’t more microservices in play. This shows that likely most of these enterprises are simply implementing parts of their applications into microservices as most of the users are only working with less than ten microservices.
Back to topChallenges With Microservices in Java
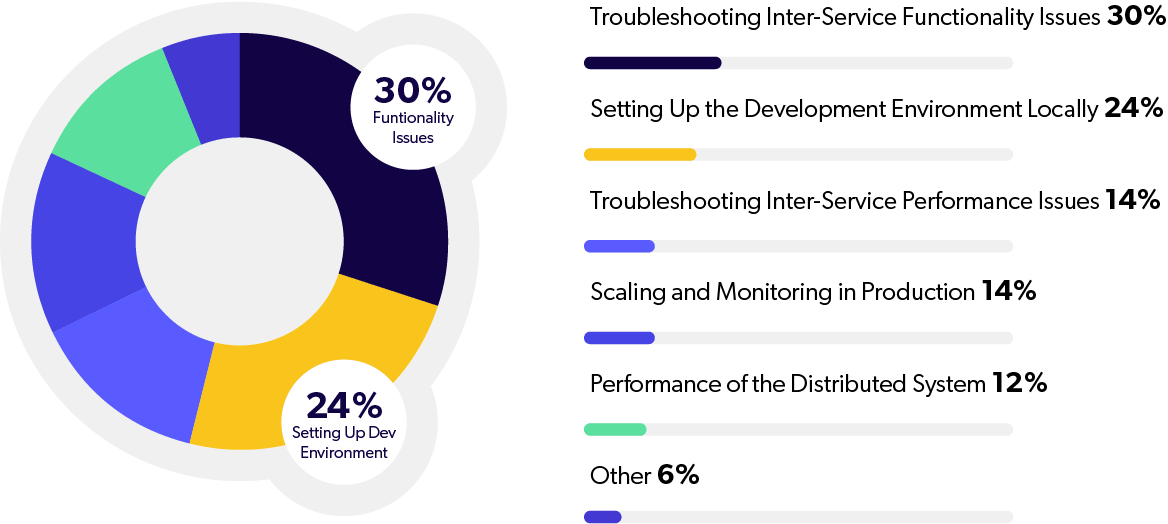
Microservice architecture is clearly highly discussed and adopted in the Java community. However, it does not come without its own unique challenges. With the complexity in which microservices interact, it’s no surprise that the biggest challenges developers face is troubleshooting inter-service functionality issues.
Other challenges:
- Setting up the development environment locally.
- Troubleshooting inter-service performance issues.
- Scaling and monitoring in production.
- Performance of the distributed system
What this means: These issues mirror last year’s results. However, last year the biggest challenge was setting up the development environment locally, at 41% of respondents. The number two answer was troubleshooting inter-service functionality issues at 38%. This shows that companies have settled into microservices, but are now struggling to contain all the applications within the microservice architecture.
Back to topAverage Redeploy Times
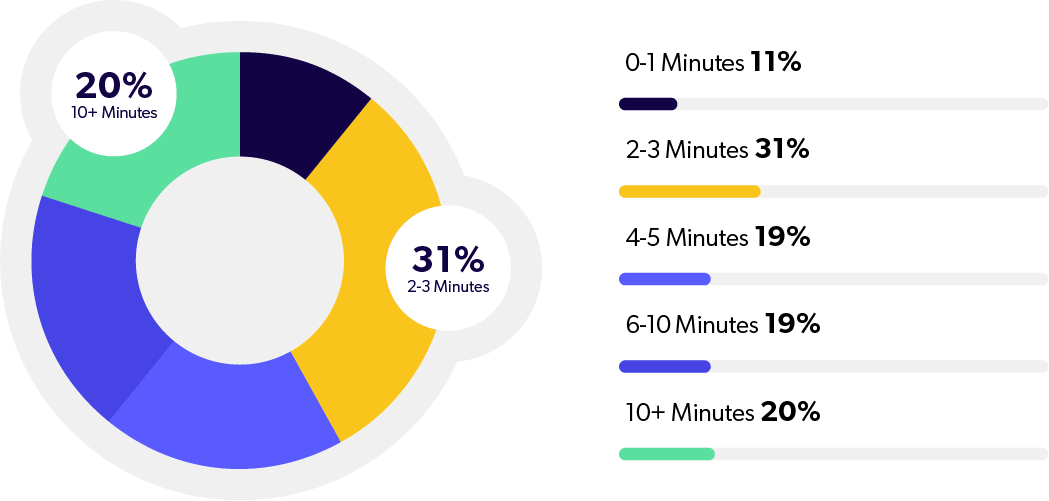
We asked developers how long it takes them to compile, package, and redeploy their application to a visibility-changed state at runtime. While this is not a microservices-specific question, the answers showed some surprising crossover.
The categories respondents could choose from included 0-1 minutes, 2-3 minutes, 4-5 minutes, 6-10 minutes, and 10+ minutes. At the top, just like last year, the most common redeploy time was between 2-3 minutes with 31% of respondents.
Whereas last year the second-highest choice was 0-1 minutes, this has shifted to a near three-way tie for all choices of four minutes or greater; each had between 19% and 20% of respondents.
What this means: With nearly half of respondents saying they primarily use microservices as their architecture, it is interesting to see that 59% are experiencing reload times over four minutes. Twenty percent are even reporting reload times greater than ten minutes! This leads us to think that many of these teams with microservices architecture are running numerous services on a Docker instance which tends to increase the redeploy times.
Related: JRebel can save you hundreds of hours of development time. Use our ROI calculator to see how much time it could save you or your business.
Back to topJava Microservices Developer Report Summary
Whether it’s the technologies Java developers use, or the problems they experience during development, microservices undoubtedly impact the Java development process. With microservices still a developer favorite, we expect to see these trends persist throughout the next year.
Looking to Troubleshoot Java Microservices Issues?
XRebel allows developers to trace the impact of their code from beginning to end, even in distributed applications.